

136
M. Talebi et al.
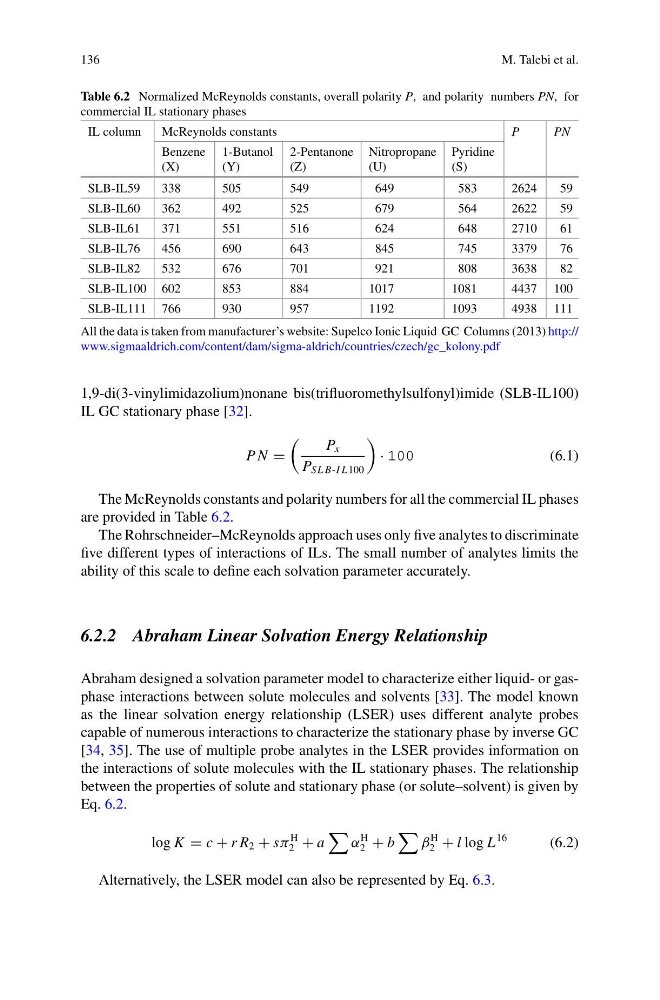
Table 6.2 Normalized McReynolds constants, overall polarity P, and polarity numbers PN, for
commercial IL stationary phases
IL column
McReynolds constants
P
PN
Benzene
(X)
1-Butanol
(Y)
2-Pentanone
(Z)
Nitropropane
(U)
Pyridine
(S)
SLB-IL59
338
505
549
649
583
2624
59
SLB-IL60
362
492
525
679
564
2622
59
SLB-IL61
371
551
516
624
648
2710
61
SLB-IL76
456
690
643
845
745
3379
76
SLB-IL82
532
676
701
921
808
3638
82
SLB-IL100 602
853
884
1017
1081
4437 100
SLB-IL111 766
930
957
1192
1093
4938 111
All the data is taken from manufacturer’s website: Supelco Ionic Liquid GC Columns (2013) http://
www.sigmaaldrich.com/content/dam/sigma-aldrich/countries/czech/gc_kolony.pdf
1,9-di(3-vinylimidazolium)nonane bis(trifluoromethylsulfonyl)imide (SLB-IL100)
IL GC stationary phase [32].
P N =
P x
P SL B-I L100
· 100
(6.1)
The McReynolds constants and polarity numbers for all the commercial IL phases
are provided in Table 6.2.
The Rohrschneider–McReynolds approach uses only five analytes to discriminate
five different types of interactions of ILs. The small number of analytes limits the
ability of this scale to define each solvation parameter accurately.
6.2.2 Abraham Linear Solvation Energy Relationship
Abraham designed a solvation parameter model to characterize either liquid- or gasphase interactions between solute molecules and solvents [33]. The model known
as the linear solvation energy relationship (LSER) uses different analyte probes
capable of numerous interactions to characterize the stationary phase by inverse GC
[34, 35]. The use of multiple probe analytes in the LSER provides information on
the interactions of solute molecules with the IL stationary phases. The relationship
between the properties of solute and stationary phase (or solute–solvent) is given by
Eq. 6.2.
log K = c + r R 2 + sπ
H
2 + a
α
H
2 + b
β
H
2 + l log L
16
(6.2)
Alternatively, the LSER model can also be represented by Eq. 6.3.
M. Talebi et al.
Table 6.2 Normalized McReynolds constants, overall polarity P, and polarity numbers PN, for
commercial IL stationary phases
IL column
McReynolds constants
P
PN
Benzene
(X)
1-Butanol
(Y)
2-Pentanone
(Z)
Nitropropane
(U)
Pyridine
(S)
SLB-IL59
338
505
549
649
583
2624
59
SLB-IL60
362
492
525
679
564
2622
59
SLB-IL61
371
551
516
624
648
2710
61
SLB-IL76
456
690
643
845
745
3379
76
SLB-IL82
532
676
701
921
808
3638
82
SLB-IL100 602
853
884
1017
1081
4437 100
SLB-IL111 766
930
957
1192
1093
4938 111
All the data is taken from manufacturer’s website: Supelco Ionic Liquid GC Columns (2013) http://
www.sigmaaldrich.com/content/dam/sigma-aldrich/countries/czech/gc_kolony.pdf
1,9-di(3-vinylimidazolium)nonane bis(trifluoromethylsulfonyl)imide (SLB-IL100)
IL GC stationary phase [32].
P N =
P x
P SL B-I L100
· 100
(6.1)
The McReynolds constants and polarity numbers for all the commercial IL phases
are provided in Table 6.2.
The Rohrschneider–McReynolds approach uses only five analytes to discriminate
five different types of interactions of ILs. The small number of analytes limits the
ability of this scale to define each solvation parameter accurately.
6.2.2 Abraham Linear Solvation Energy Relationship
Abraham designed a solvation parameter model to characterize either liquid- or gasphase interactions between solute molecules and solvents [33]. The model known
as the linear solvation energy relationship (LSER) uses different analyte probes
capable of numerous interactions to characterize the stationary phase by inverse GC
[34, 35]. The use of multiple probe analytes in the LSER provides information on
the interactions of solute molecules with the IL stationary phases. The relationship
between the properties of solute and stationary phase (or solute–solvent) is given by
Eq. 6.2.
log K = c + r R 2 + sπ
H
2 + a
α
H
2 + b
β
H
2 + l log L
16
(6.2)
Alternatively, the LSER model can also be represented by Eq. 6.3.