

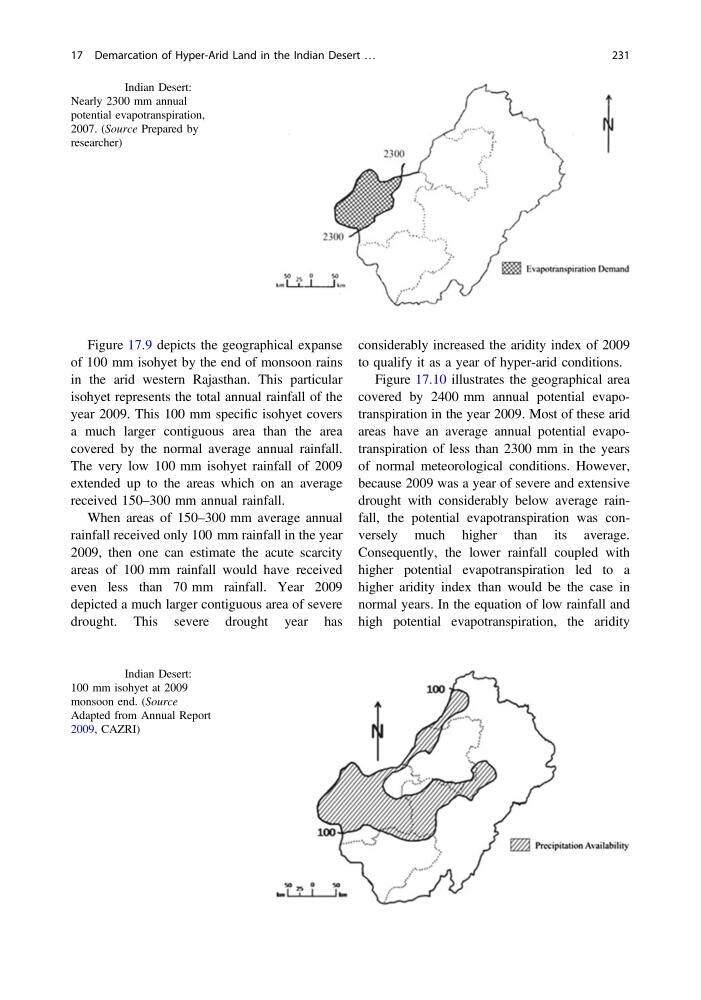
Figure 17.9 depicts the geographical expanse
of 100 mm isohyet by the end of monsoon rains
in the arid western Rajasthan. This particular
isohyet represents the total annual rainfall of the
year 2009. This 100 mm specific isohyet covers
a much larger contiguous area than the area
covered by the normal average annual rainfall.
The very low 100 mm isohyet rainfall of 2009
extended up to the areas which on an average
received 150–300 mm annual rainfall.
When areas of 150–300 mm average annual
rainfall received only 100 mm rainfall in the year
2009, then one can estimate the acute scarcity
areas of 100 mm rainfall would have received
even less than 70 mm rainfall. Year 2009
depicted a much larger contiguous area of severe
drought. This severe drought year has
considerably increased the aridity index of 2009
to qualify it as a year of hyper-arid conditions.
Figure 17.10 illustrates the geographical area
covered by 2400 mm annual potential evapotranspiration in the year 2009. Most of these arid
areas have an average annual potential evapotranspiration of less than 2300 mm in the years
of normal meteorological conditions. However,
because 2009 was a year of severe and extensive
drought with considerably below average rainfall, the potential evapotranspiration was conversely much higher than its average.
Consequently, the lower rainfall coupled with
higher potential evapotranspiration led to a
higher aridity index than would be the case in
normal years. In the equation of low rainfall and
high potential evapotranspiration, the aridity
Fig. 17.8 Indian Desert:
Nearly 2300 mm annual
potential evapotranspiration,
2007. (Source Prepared by
researcher)
Fig. 17.9 Indian Desert:
100 mm isohyet at 2009
monsoon end. (Source
Adapted from Annual Report
2009, CAZRI)
17 Demarcation of Hyper-Arid Land in the Indian Desert …
231
of 100 mm isohyet by the end of monsoon rains
in the arid western Rajasthan. This particular
isohyet represents the total annual rainfall of the
year 2009. This 100 mm specific isohyet covers
a much larger contiguous area than the area
covered by the normal average annual rainfall.
The very low 100 mm isohyet rainfall of 2009
extended up to the areas which on an average
received 150–300 mm annual rainfall.
When areas of 150–300 mm average annual
rainfall received only 100 mm rainfall in the year
2009, then one can estimate the acute scarcity
areas of 100 mm rainfall would have received
even less than 70 mm rainfall. Year 2009
depicted a much larger contiguous area of severe
drought. This severe drought year has
considerably increased the aridity index of 2009
to qualify it as a year of hyper-arid conditions.
Figure 17.10 illustrates the geographical area
covered by 2400 mm annual potential evapotranspiration in the year 2009. Most of these arid
areas have an average annual potential evapotranspiration of less than 2300 mm in the years
of normal meteorological conditions. However,
because 2009 was a year of severe and extensive
drought with considerably below average rainfall, the potential evapotranspiration was conversely much higher than its average.
Consequently, the lower rainfall coupled with
higher potential evapotranspiration led to a
higher aridity index than would be the case in
normal years. In the equation of low rainfall and
high potential evapotranspiration, the aridity
Fig. 17.8 Indian Desert:
Nearly 2300 mm annual
potential evapotranspiration,
2007. (Source Prepared by
researcher)
Fig. 17.9 Indian Desert:
100 mm isohyet at 2009
monsoon end. (Source
Adapted from Annual Report
2009, CAZRI)
17 Demarcation of Hyper-Arid Land in the Indian Desert …
231