

between Manapad and Koodankulam zone.
Sodium is found to be associated with high
concentration of chloride resulting in salinity.
Water with high sodium content is not suitable
for agricultural use as it tends to deteriorate the
soils.
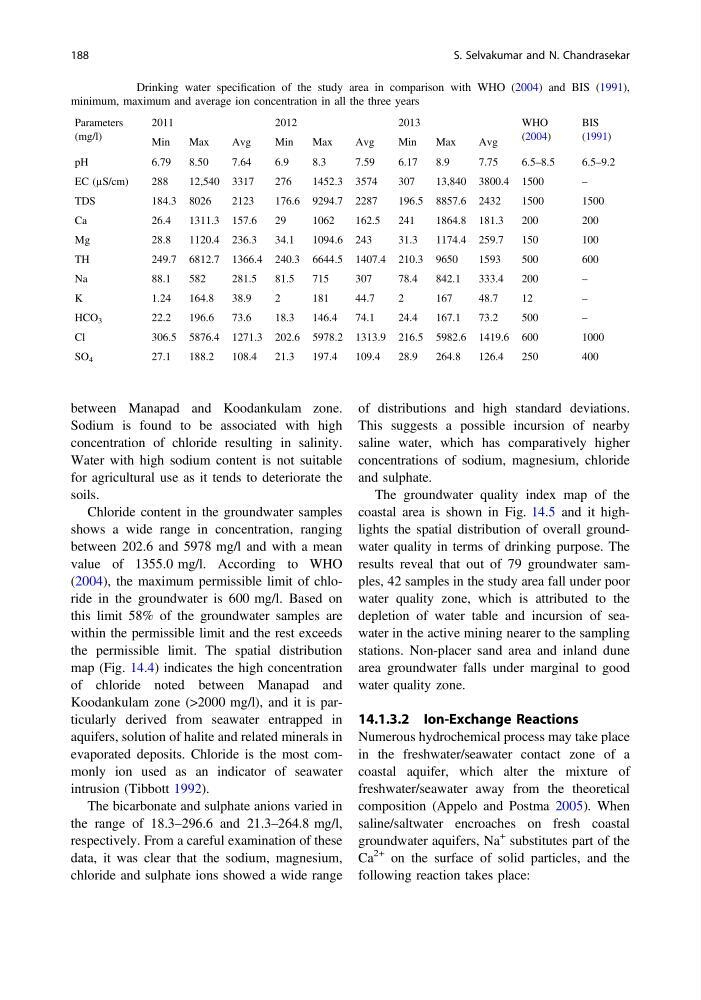
Chloride content in the groundwater samples
shows a wide range in concentration, ranging
between 202.6 and 5978 mg/l and with a mean
value of 1355.0 mg/l. According to WHO
(2004), the maximum permissible limit of chloride in the groundwater is 600 mg/l. Based on
this limit 58% of the groundwater samples are
within the permissible limit and the rest exceeds
the permissible limit. The spatial distribution
map (Fig. 14.4) indicates the high concentration
of chloride noted between Manapad and
Koodankulam zone (>2000 mg/l), and it is particularly derived from seawater entrapped in
aquifers, solution of halite and related minerals in
evaporated deposits. Chloride is the most commonly ion used as an indicator of seawater
intrusion (Tibbott 1992).
The bicarbonate and sulphate anions varied in
the range of 18.3–296.6 and 21.3–264.8 mg/l,
respectively. From a careful examination of these
data, it was clear that the sodium, magnesium,
chloride and sulphate ions showed a wide range
of distributions and high standard deviations.
This suggests a possible incursion of nearby
saline water, which has comparatively higher
concentrations of sodium, magnesium, chloride
and sulphate.
The groundwater quality index map of the
coastal area is shown in Fig. 14.5 and it highlights the spatial distribution of overall groundwater quality in terms of drinking purpose. The
results reveal that out of 79 groundwater samples, 42 samples in the study area fall under poor
water quality zone, which is attributed to the
depletion of water table and incursion of seawater in the active mining nearer to the sampling
stations. Non-placer sand area and inland dune
area groundwater falls under marginal to good
water quality zone.
14.1.3.2 Ion-Exchange Reactions
Numerous hydrochemical process may take place
in the freshwater/seawater contact zone of a
coastal aquifer, which alter the mixture of
freshwater/seawater away from the theoretical
composition (Appelo and Postma 2005). When
saline/saltwater encroaches on fresh coastal
groundwater aquifers, Na
+ substitutes part of the
Ca
2+ on the surface of solid particles, and the
following reaction takes place:
Table 14.1 Drinking water specification of the study area in comparison with WHO (2004) and BIS (1991),
minimum, maximum and average ion concentration in all the three years
Parameters
(mg/l)
2011
2012
2013
WHO
(2004)
BIS
(1991)
Min
Max
Avg
Min
Max
Avg
Min
Max
Avg
pH
6.79
8.50
7.64
6.9
8.3
7.59
6.17
8.9
7.75
6.5–8.5
6.5–9.2
EC (µS/cm)
288
12,540 3317
276
1452.3 3574
307
13,840 3800.4 1500
–
TDS
184.3 8026
2123
176.6 9294.7 2287
196.5 8857.6 2432
1500
1500
Ca
26.4
1311.3 157.6
29
1062
162.5
241
1864.8 181.3
200
200
Mg
28.8
1120.4 236.3
34.1
1094.6 243
31.3
1174.4 259.7
150
100
TH
249.7 6812.7 1366.4 240.3 6644.5 1407.4 210.3 9650
1593
500
600
Na
88.1
582
281.5
81.5
715
307
78.4
842.1
333.4
200
–
K
1.24
164.8
38.9
2
181
44.7
2
167
48.7
12
–
HCO 3
22.2
196.6
73.6
18.3
146.4
74.1
24.4
167.1
73.2
500
–
Cl
306.5 5876.4 1271.3 202.6 5978.2 1313.9 216.5 5982.6 1419.6 600
1000
SO 4
27.1
188.2
108.4
21.3
197.4
109.4
28.9
264.8
126.4
250
400
188
S. Selvakumar and N. Chandrasekar
Sodium is found to be associated with high
concentration of chloride resulting in salinity.
Water with high sodium content is not suitable
for agricultural use as it tends to deteriorate the
soils.
Chloride content in the groundwater samples
shows a wide range in concentration, ranging
between 202.6 and 5978 mg/l and with a mean
value of 1355.0 mg/l. According to WHO
(2004), the maximum permissible limit of chloride in the groundwater is 600 mg/l. Based on
this limit 58% of the groundwater samples are
within the permissible limit and the rest exceeds
the permissible limit. The spatial distribution
map (Fig. 14.4) indicates the high concentration
of chloride noted between Manapad and
Koodankulam zone (>2000 mg/l), and it is particularly derived from seawater entrapped in
aquifers, solution of halite and related minerals in
evaporated deposits. Chloride is the most commonly ion used as an indicator of seawater
intrusion (Tibbott 1992).
The bicarbonate and sulphate anions varied in
the range of 18.3–296.6 and 21.3–264.8 mg/l,
respectively. From a careful examination of these
data, it was clear that the sodium, magnesium,
chloride and sulphate ions showed a wide range
of distributions and high standard deviations.
This suggests a possible incursion of nearby
saline water, which has comparatively higher
concentrations of sodium, magnesium, chloride
and sulphate.
The groundwater quality index map of the
coastal area is shown in Fig. 14.5 and it highlights the spatial distribution of overall groundwater quality in terms of drinking purpose. The
results reveal that out of 79 groundwater samples, 42 samples in the study area fall under poor
water quality zone, which is attributed to the
depletion of water table and incursion of seawater in the active mining nearer to the sampling
stations. Non-placer sand area and inland dune
area groundwater falls under marginal to good
water quality zone.
14.1.3.2 Ion-Exchange Reactions
Numerous hydrochemical process may take place
in the freshwater/seawater contact zone of a
coastal aquifer, which alter the mixture of
freshwater/seawater away from the theoretical
composition (Appelo and Postma 2005). When
saline/saltwater encroaches on fresh coastal
groundwater aquifers, Na
+ substitutes part of the
Ca
2+ on the surface of solid particles, and the
following reaction takes place:
Table 14.1 Drinking water specification of the study area in comparison with WHO (2004) and BIS (1991),
minimum, maximum and average ion concentration in all the three years
Parameters
(mg/l)
2011
2012
2013
WHO
(2004)
BIS
(1991)
Min
Max
Avg
Min
Max
Avg
Min
Max
Avg
pH
6.79
8.50
7.64
6.9
8.3
7.59
6.17
8.9
7.75
6.5–8.5
6.5–9.2
EC (µS/cm)
288
12,540 3317
276
1452.3 3574
307
13,840 3800.4 1500
–
TDS
184.3 8026
2123
176.6 9294.7 2287
196.5 8857.6 2432
1500
1500
Ca
26.4
1311.3 157.6
29
1062
162.5
241
1864.8 181.3
200
200
Mg
28.8
1120.4 236.3
34.1
1094.6 243
31.3
1174.4 259.7
150
100
TH
249.7 6812.7 1366.4 240.3 6644.5 1407.4 210.3 9650
1593
500
600
Na
88.1
582
281.5
81.5
715
307
78.4
842.1
333.4
200
–
K
1.24
164.8
38.9
2
181
44.7
2
167
48.7
12
–
HCO 3
22.2
196.6
73.6
18.3
146.4
74.1
24.4
167.1
73.2
500
–
Cl
306.5 5876.4 1271.3 202.6 5978.2 1313.9 216.5 5982.6 1419.6 600
1000
SO 4
27.1
188.2
108.4
21.3
197.4
109.4
28.9
264.8
126.4
250
400
188
S. Selvakumar and N. Chandrasekar