

some false alarms of the potential water toxicity,
the BioArgus-W is equipped with the water
quality monitoring module to measure some
physical–chemical parameters of water. The
module provides control for selected integral
physical–chemical parameters of incoming water
as well as noise and vibration with a specially
designed decision-making algorithm to block
alarm signals.
For each crayfish biomarker of effect and
exposure, the threshold level is adjusted to produce alarm signal if exceeded the values considered to be the reference values for crayfish
cardiac activity. To set up a threshold value, it is
necessary to consider the following assumption.
High threshold levels decrease system sensitivity, as the animal stress has to be rather high to
exceed the threshold for alarm signal. On the
contrary, low threshold levels induce alarm signals for any insignificant excitation of the
biosensor even not related to the dangerous
change of water quality. Thus, there is a problem
to determine optimal threshold values for measuring parameters and develop algorithms for
information processing: on the one hand, sensitivity of the system has to be sufficient to identify
dangerous pollution, but, the frequency of false
alarms has to be minimal. Operating the
biomonitoring stations and saved-up database
analysis have allowed us to approach the solution
of this problem in the following way.
HR analysis of each test organisms is made
independently. For each biomarker of the animal
physiological condition, the threshold level (L B )
is set up to specify a stress state. An alarm signal
of possible pollution arises in case when test
organisms change their state to stress during
rather short operating time (T o ). T o is set up in
the settings of the BioArgus-W software. The
main biomarkers for the system to make decision
about stress state are SI and dHR:
dHR t
ð Þ ¼
HR t
ð Þ À HR t À T d
ð
Þ
HR t À T d
ð
Þ
Á 100% ð10:1Þ
where HR(t)—heart rate for the time t; T d —
delay time.
Thus, the decision-making procedure to alarm
emergency includes three parameters: L B , T o and
T d . The analysis of influence of each of these
parameters on biomonitoring station sensitivity
showed the following (Kinebas et al. 2012):
1. Decrease in L B involves increase in station
sensitivity, as in this case a smaller stressful
impact on the bioindicator is necessary for
corresponding parameter to exceed L B . At the
same time, the system reliability decreases as
the probability of false alarms increases in
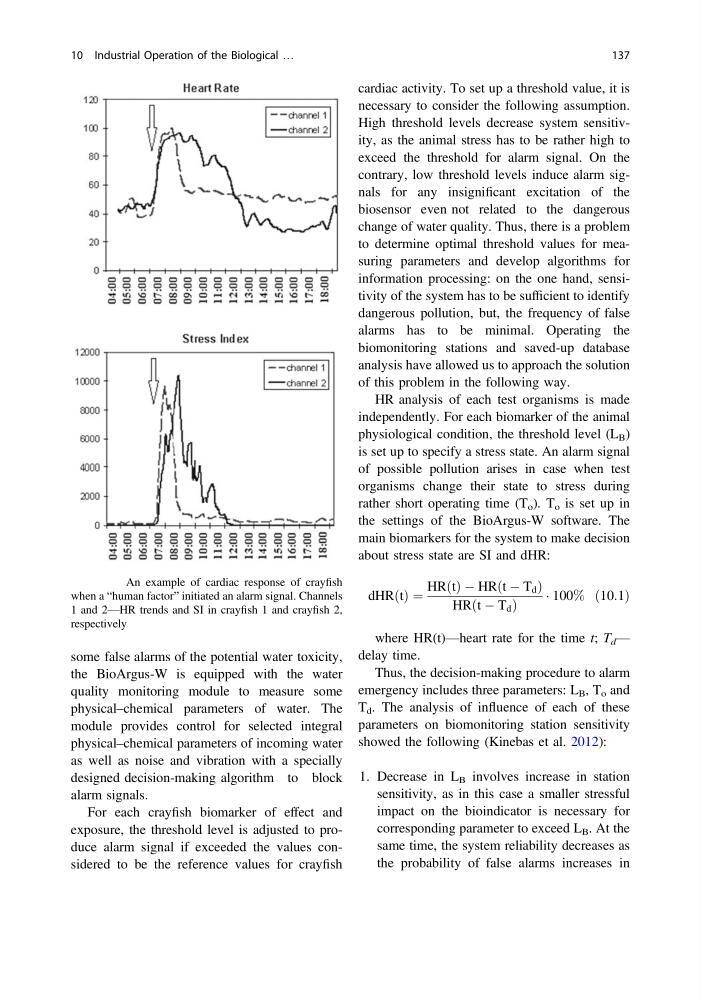
Fig. 10.9 An example of cardiac response of crayfish
when a “human factor” initiated an alarm signal. Channels
1 and 2—HR trends and SI in crayfish 1 and crayfish 2,
respectively
10 Industrial Operation of the Biological …
137
the BioArgus-W is equipped with the water
quality monitoring module to measure some
physical–chemical parameters of water. The
module provides control for selected integral
physical–chemical parameters of incoming water
as well as noise and vibration with a specially
designed decision-making algorithm to block
alarm signals.
For each crayfish biomarker of effect and
exposure, the threshold level is adjusted to produce alarm signal if exceeded the values considered to be the reference values for crayfish
cardiac activity. To set up a threshold value, it is
necessary to consider the following assumption.
High threshold levels decrease system sensitivity, as the animal stress has to be rather high to
exceed the threshold for alarm signal. On the
contrary, low threshold levels induce alarm signals for any insignificant excitation of the
biosensor even not related to the dangerous
change of water quality. Thus, there is a problem
to determine optimal threshold values for measuring parameters and develop algorithms for
information processing: on the one hand, sensitivity of the system has to be sufficient to identify
dangerous pollution, but, the frequency of false
alarms has to be minimal. Operating the
biomonitoring stations and saved-up database
analysis have allowed us to approach the solution
of this problem in the following way.
HR analysis of each test organisms is made
independently. For each biomarker of the animal
physiological condition, the threshold level (L B )
is set up to specify a stress state. An alarm signal
of possible pollution arises in case when test
organisms change their state to stress during
rather short operating time (T o ). T o is set up in
the settings of the BioArgus-W software. The
main biomarkers for the system to make decision
about stress state are SI and dHR:
dHR t
ð Þ ¼
HR t
ð Þ À HR t À T d
ð
Þ
HR t À T d
ð
Þ
Á 100% ð10:1Þ
where HR(t)—heart rate for the time t; T d —
delay time.
Thus, the decision-making procedure to alarm
emergency includes three parameters: L B , T o and
T d . The analysis of influence of each of these
parameters on biomonitoring station sensitivity
showed the following (Kinebas et al. 2012):
1. Decrease in L B involves increase in station
sensitivity, as in this case a smaller stressful
impact on the bioindicator is necessary for
corresponding parameter to exceed L B . At the
same time, the system reliability decreases as
the probability of false alarms increases in
Fig. 10.9 An example of cardiac response of crayfish
when a “human factor” initiated an alarm signal. Channels
1 and 2—HR trends and SI in crayfish 1 and crayfish 2,
respectively
10 Industrial Operation of the Biological …
137