

408
in representing the ecological variability that differs across houses more probably than
the socioeconomic characteristics [20, 21]. Line transect that must cut across different
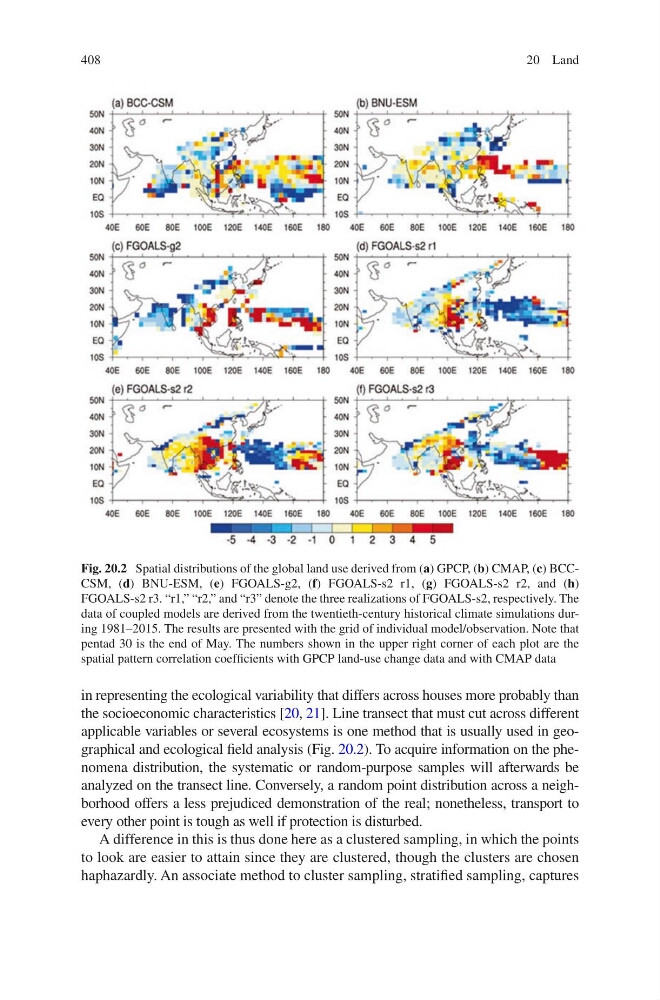
applicable variables or several ecosystems is one method that is usually used in geographical and ecological field analysis (Fig. 20.2). To acquire information on the phenomena distribution, the systematic or random-purpose samples will afterwards be
analyzed on the transect line. Conversely, a random point distribution across a neighborhood offers a less prejudiced demonstration of the real; nonetheless, transport to
every other point is tough as well if protection is disturbed.
A difference in this is thus done here as a clustered sampling, in which the points
to look are easier to attain since they are clustered, though the clusters are chosen
haphazardly. An associate method to cluster sampling, stratified sampling, captures
Fig. 20.2 Spatial distributions of the global land use derived from (a) GPCP, (b) CMAP, (c) BCCCSM, (d) BNU-ESM, (e) FGOALS-g2, (f) FGOALS-s2 r1, (g) FGOALS-s2 r2, and (h)
FGOALS-s2 r3. “r1,” “r2,” and “r3” denote the three realizations of FGOALS-s2, respectively. The
data of coupled models are derived from the twentieth-century historical climate simulations during 1981–2015. The results are presented with the grid of individual model/observation. Note that
pentad 30 is the end of May. The numbers shown in the upper right corner of each plot are the
spatial pattern correlation coefficients with GPCP land-use change data and with CMAP data
20 Land
in representing the ecological variability that differs across houses more probably than
the socioeconomic characteristics [20, 21]. Line transect that must cut across different
applicable variables or several ecosystems is one method that is usually used in geographical and ecological field analysis (Fig. 20.2). To acquire information on the phenomena distribution, the systematic or random-purpose samples will afterwards be
analyzed on the transect line. Conversely, a random point distribution across a neighborhood offers a less prejudiced demonstration of the real; nonetheless, transport to
every other point is tough as well if protection is disturbed.
A difference in this is thus done here as a clustered sampling, in which the points
to look are easier to attain since they are clustered, though the clusters are chosen
haphazardly. An associate method to cluster sampling, stratified sampling, captures
Fig. 20.2 Spatial distributions of the global land use derived from (a) GPCP, (b) CMAP, (c) BCCCSM, (d) BNU-ESM, (e) FGOALS-g2, (f) FGOALS-s2 r1, (g) FGOALS-s2 r2, and (h)
FGOALS-s2 r3. “r1,” “r2,” and “r3” denote the three realizations of FGOALS-s2, respectively. The
data of coupled models are derived from the twentieth-century historical climate simulations during 1981–2015. The results are presented with the grid of individual model/observation. Note that
pentad 30 is the end of May. The numbers shown in the upper right corner of each plot are the
spatial pattern correlation coefficients with GPCP land-use change data and with CMAP data
20 Land