

398
Wide reports of 19 countries using a variety of time-, flow-, and volumeproportional sampling attempted to investigate inter-day variability (i.e., over a
1-week period) of chemicals in influent wastewater [3, 22, 23]. Collated reports
revealed a trend of recreational use for some compounds [24, 25]. Both organic and
inorganic chemicals showed elevated levels of water contaminants. In contrast, it is
anticipated that also hospital-dispensed chemicals such as chlorine, acetaminophen,
amitriptyline, EMDP, dosulepin, fluoxetine, norfluoxetine, triclosan, ofloxacin, and
ciprofloxacin and anticancer chemicals are observed at higher concentrations in the
wastewater body. Inter-day variability of EC concentration is difficult to fully appreciate without conducting flow-proportional sampling. This is most significant when
comparing weekday and weekend periods where wastewater flows can vary notably.
Differences in weekday/weekend flow will be specific for the catchment in question. For example, a residential (commuter) or tourist area will see increased flow
during weekends. On the other hand, a catchment containing industrial works may
observe a reduction in flow and dilution during weekends. Rainfall will also result
in changes to wastewater flow between days. This illustrates that reporting load
(mass per day) over the traditional approach of concentration (mass per liter) to
overcome temporal variations in flow is more suited to describe findings.
Emerging contaminant analysis in wastewaters tends to be undertaken on the
aqueous phase only (i.e., a pre-filtered sample). Particulate-phase analysis is not
routinely undertaken because up to 1 g of dry solids is often required for each analysis and additional sample extraction is needed [26, 27]. However, the report here is
essential as some chemicals have a high affinity to particulate matter. Numerous
chemicals including chlorine, acetaminophen, amitriptyline, EMDP, dosulepin,
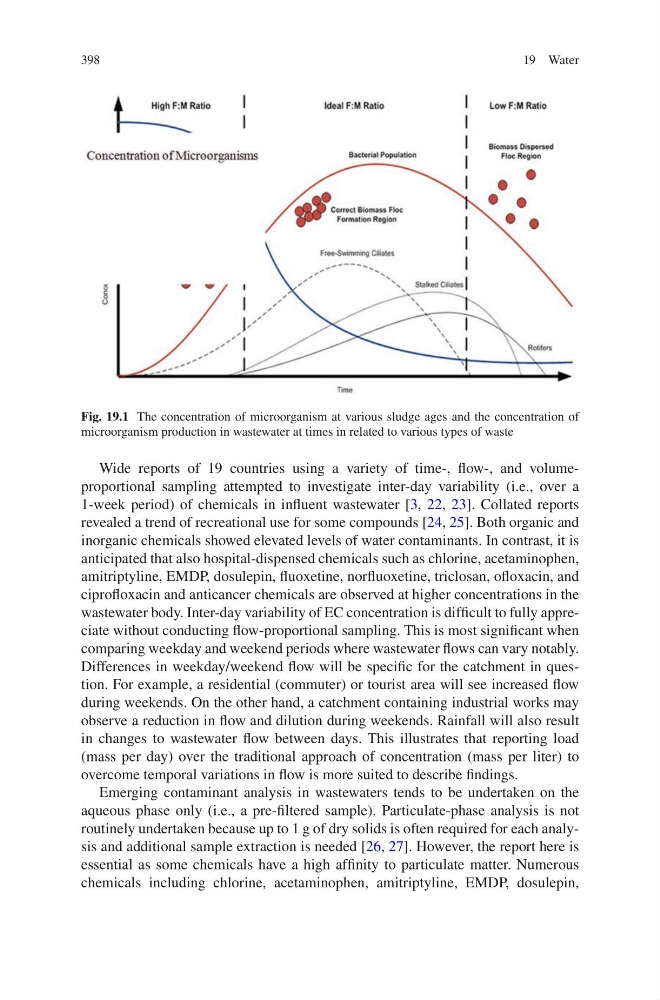
Fig. 19.1 The concentration of microorganism at various sludge ages and the concentration of
microorganism production in wastewater at times in related to various types of waste
19 Water
Wide reports of 19 countries using a variety of time-, flow-, and volumeproportional sampling attempted to investigate inter-day variability (i.e., over a
1-week period) of chemicals in influent wastewater [3, 22, 23]. Collated reports
revealed a trend of recreational use for some compounds [24, 25]. Both organic and
inorganic chemicals showed elevated levels of water contaminants. In contrast, it is
anticipated that also hospital-dispensed chemicals such as chlorine, acetaminophen,
amitriptyline, EMDP, dosulepin, fluoxetine, norfluoxetine, triclosan, ofloxacin, and
ciprofloxacin and anticancer chemicals are observed at higher concentrations in the
wastewater body. Inter-day variability of EC concentration is difficult to fully appreciate without conducting flow-proportional sampling. This is most significant when
comparing weekday and weekend periods where wastewater flows can vary notably.
Differences in weekday/weekend flow will be specific for the catchment in question. For example, a residential (commuter) or tourist area will see increased flow
during weekends. On the other hand, a catchment containing industrial works may
observe a reduction in flow and dilution during weekends. Rainfall will also result
in changes to wastewater flow between days. This illustrates that reporting load
(mass per day) over the traditional approach of concentration (mass per liter) to
overcome temporal variations in flow is more suited to describe findings.
Emerging contaminant analysis in wastewaters tends to be undertaken on the
aqueous phase only (i.e., a pre-filtered sample). Particulate-phase analysis is not
routinely undertaken because up to 1 g of dry solids is often required for each analysis and additional sample extraction is needed [26, 27]. However, the report here is
essential as some chemicals have a high affinity to particulate matter. Numerous
chemicals including chlorine, acetaminophen, amitriptyline, EMDP, dosulepin,
Fig. 19.1 The concentration of microorganism at various sludge ages and the concentration of
microorganism production in wastewater at times in related to various types of waste
19 Water