

298
where k i is the true log-linear deactivation rate constant for the reaction between
generated ROS with bacteria. The pseudo-adsorption constant, K i , represents the
surface interaction between the catalyst and bacteria. This constant is similar to the
adsorption equilibrium constant in the conventional L–H model. Due to the significant size differences between E. coli cells and catalyst agglomerates, these constants do not represent strict adsorption phenomena but a more general surface
interaction during photo-disinfection. These adsorption constants allow the “shoulder” representation in the photo-disinfection kinetics data. The inhibition coefficient η i is a power coefficient that accounts for the “tailing” in the bacterium
inactivation curve. Marugán et al. [211] proposed that η i is needed to account for the
inhibition produced by the increasing concentrations in the medium of cell lysis and
oxidation products competing for the ROS. This is particularly important toward the
end of photo-disinfection, as high concentrations of these compounds and small
numbers of viable bacteria are present in the suspension. In this instance, the η i in
the proposed L–H model essentially means that the reaction order with respect to
the microbial population is higher than 1.
Both Eqs. (13.41) and (13.42) have six independent parameters that describe
photo-disinfection rates. This constitutes a high risk of over-fitting the experimental
data, where the statistical significance of parameters and the plausibility of the
model are low. By taking into account the intrinsic kinetics of ROS attack, the catalyst–bacterium interaction and the inhibition by-products are similar for both
undamaged and damaged bacteria, and the following are assumed:
k k k
1
2
= =
(13.43)
k
k
K
undam
d am
= =
(13.44)
η
η
η
undam
d am
=
=
(13.44)
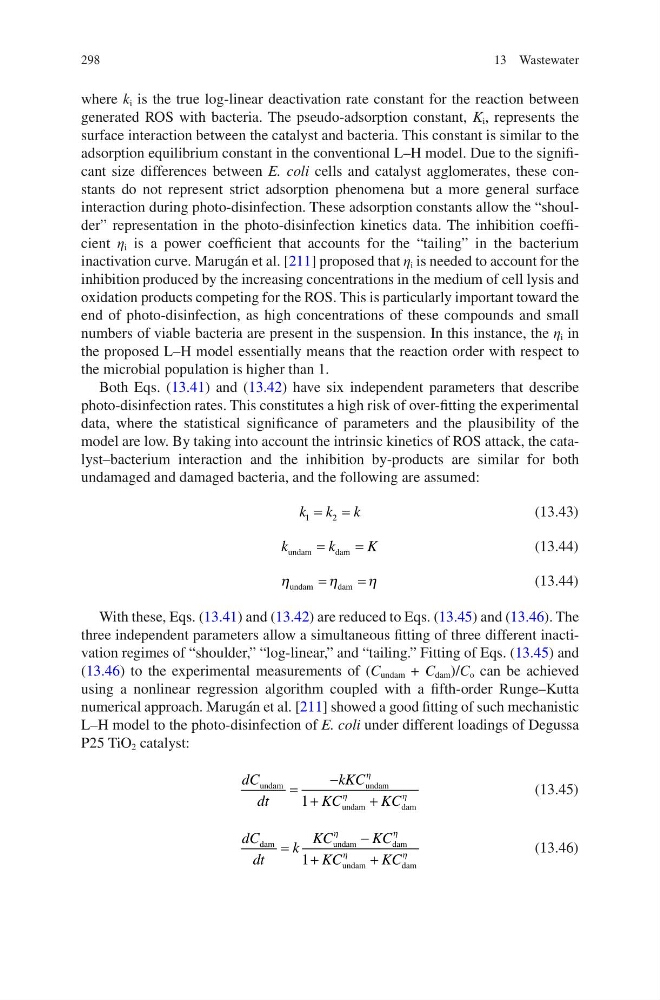
With these, Eqs. (13.41) and (13.42) are reduced to Eqs. (13.45) and (13.46). The
three independent parameters allow a simultaneous fitting of three different inactivation regimes of “shoulder,” “log-linear,” and “tailing.” Fitting of Eqs. (13.45) and
(13.46) to the experimental measurements of (C undam + C dam )/C o can be achieved
using a nonlinear regression algorithm coupled with a fifth-order Runge–Kutta
numerical approach. Marugán et al. [211] showed a good fitting of such mechanistic
L–H model to the photo-disinfection of E. coli under different loadings of Degussa
P25 TiO 2 catalyst:
dC
dt
kKC
KC
KC
undam
undam
undam
d am
=
−
+
+
η
η
η
1
(13.45)
dC
dt
k
KC
KC
KC
KC
dam
undam
d am
undam
d am
=
−
+
+
η
η
η
η
1
(13.46)
13 Wastewater
where k i is the true log-linear deactivation rate constant for the reaction between
generated ROS with bacteria. The pseudo-adsorption constant, K i , represents the
surface interaction between the catalyst and bacteria. This constant is similar to the
adsorption equilibrium constant in the conventional L–H model. Due to the significant size differences between E. coli cells and catalyst agglomerates, these constants do not represent strict adsorption phenomena but a more general surface
interaction during photo-disinfection. These adsorption constants allow the “shoulder” representation in the photo-disinfection kinetics data. The inhibition coefficient η i is a power coefficient that accounts for the “tailing” in the bacterium
inactivation curve. Marugán et al. [211] proposed that η i is needed to account for the
inhibition produced by the increasing concentrations in the medium of cell lysis and
oxidation products competing for the ROS. This is particularly important toward the
end of photo-disinfection, as high concentrations of these compounds and small
numbers of viable bacteria are present in the suspension. In this instance, the η i in
the proposed L–H model essentially means that the reaction order with respect to
the microbial population is higher than 1.
Both Eqs. (13.41) and (13.42) have six independent parameters that describe
photo-disinfection rates. This constitutes a high risk of over-fitting the experimental
data, where the statistical significance of parameters and the plausibility of the
model are low. By taking into account the intrinsic kinetics of ROS attack, the catalyst–bacterium interaction and the inhibition by-products are similar for both
undamaged and damaged bacteria, and the following are assumed:
k k k
1
2
= =
(13.43)
k
k
K
undam
d am
= =
(13.44)
η
η
η
undam
d am
=
=
(13.44)
With these, Eqs. (13.41) and (13.42) are reduced to Eqs. (13.45) and (13.46). The
three independent parameters allow a simultaneous fitting of three different inactivation regimes of “shoulder,” “log-linear,” and “tailing.” Fitting of Eqs. (13.45) and
(13.46) to the experimental measurements of (C undam + C dam )/C o can be achieved
using a nonlinear regression algorithm coupled with a fifth-order Runge–Kutta
numerical approach. Marugán et al. [211] showed a good fitting of such mechanistic
L–H model to the photo-disinfection of E. coli under different loadings of Degussa
P25 TiO 2 catalyst:
dC
dt
kKC
KC
KC
undam
undam
undam
d am
=
−
+
+
η
η
η
1
(13.45)
dC
dt
k
KC
KC
KC
KC
dam
undam
d am
undam
d am
=
−
+
+
η
η
η
η
1
(13.46)
13 Wastewater