

1.10 Surface Stress versus Potential Curve of Solid Metal Electrode
31
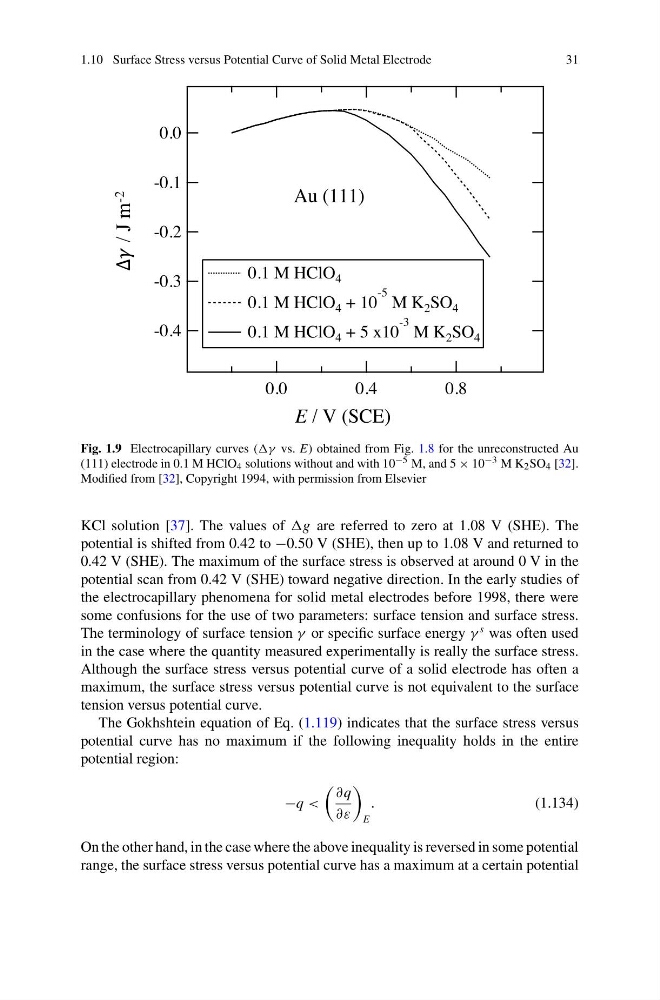
Fig. 1.9 Electrocapillary curves ((γ vs. E) obtained from Fig. 1.8 for the unreconstructed Au
(111) electrode in 0.1 M HClO 4 solutions without and with 10 −5 M, and 5 × 10 −3 M K 2 SO 4 [32].
Modified from [32], Copyright 1994, with permission from Elsevier
KCl solution [37]. The values of are referred to zero at 1.08 V (SHE). The
potential is shifted from 0.42 to −0.50 V (SHE), then up to 1.08 V and returned to
0.42 V (SHE). The maximum of the surface stress is observed at around 0 V in the
potential scan from 0.42 V (SHE) toward negative direction. In the early studies of
the electrocapillary phenomena for solid metal electrodes before 1998, there were
some confusions for the use of two parameters: surface tension and surface stress.
The terminology of surface tension γ or specific surface energy γ
s was often used
in the case where the quantity measured experimentally is really the surface stress.
Although the surface stress versus potential curve of a solid electrode has often a
maximum, the surface stress versus potential curve is not equivalent to the surface
tension versus potential curve.
The Gokhshtein equation of Eq. (1.119) indicates that the surface stress versus
potential curve has no maximum if the following inequality holds in the entire
potential region:
−q <
∂q
∂ε
E
.
(1.134)
On the other hand, in the case where the above inequality is reversed in some potential
range, the surface stress versus potential curve has a maximum at a certain potential
31
Fig. 1.9 Electrocapillary curves ((γ vs. E) obtained from Fig. 1.8 for the unreconstructed Au
(111) electrode in 0.1 M HClO 4 solutions without and with 10 −5 M, and 5 × 10 −3 M K 2 SO 4 [32].
Modified from [32], Copyright 1994, with permission from Elsevier
KCl solution [37]. The values of are referred to zero at 1.08 V (SHE). The
potential is shifted from 0.42 to −0.50 V (SHE), then up to 1.08 V and returned to
0.42 V (SHE). The maximum of the surface stress is observed at around 0 V in the
potential scan from 0.42 V (SHE) toward negative direction. In the early studies of
the electrocapillary phenomena for solid metal electrodes before 1998, there were
some confusions for the use of two parameters: surface tension and surface stress.
The terminology of surface tension γ or specific surface energy γ
s was often used
in the case where the quantity measured experimentally is really the surface stress.
Although the surface stress versus potential curve of a solid electrode has often a
maximum, the surface stress versus potential curve is not equivalent to the surface
tension versus potential curve.
The Gokhshtein equation of Eq. (1.119) indicates that the surface stress versus
potential curve has no maximum if the following inequality holds in the entire
potential region:
−q <
∂q
∂ε
E
.
(1.134)
On the other hand, in the case where the above inequality is reversed in some potential
range, the surface stress versus potential curve has a maximum at a certain potential