

30
1 Surface Thermodynamics of Solid Electrode
1.2
1.0
0.8
0.6
0.4
0.2
0.0
-0.2
q / C m
-2
0.8
0.4
0.0
E / V (SCE)
0.1 M HClO 4
0.1 M HClO 4 + 10
-5 M K 2 SO 4
0.1 M HClO 4 + 5 x10
-3 M K 2 SO 4
Au (111)
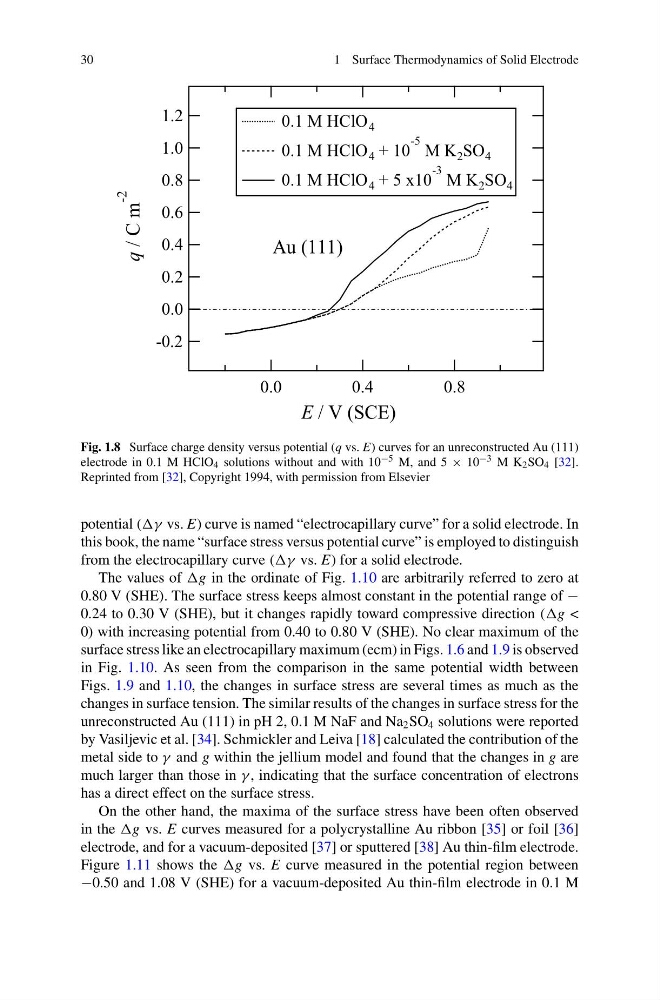
Fig. 1.8 Surface charge density versus potential (q vs. E) curves for an unreconstructed Au (111)
electrode in 0.1 M HClO 4 solutions without and with 10 −5 M, and 5 × 10 −3 M K 2 SO 4 [32].
Reprinted from [32], Copyright 1994, with permission from Elsevier
potential ((γ vs. E) curve is named “electrocapillary curve” for a solid electrode. In
this book, the name “surface stress versus potential curve” is employed to distinguish
from the electrocapillary curve ((γ vs. E) for a solid electrode.
The values of in the ordinate of Fig. 1.10 are arbitrarily referred to zero at
0.80 V (SHE). The surface stress keeps almost constant in the potential range of −
0.24 to 0.30 V (SHE), but it changes rapidly toward compressive direction ((g <
0) with increasing potential from 0.40 to 0.80 V (SHE). No clear maximum of the
surface stress like an electrocapillary maximum (ecm) in Figs. 1.6 and 1.9 is observed
in Fig. 1.10. As seen from the comparison in the same potential width between
Figs. 1.9 and 1.10, the changes in surface stress are several times as much as the
changes in surface tension. The similar results of the changes in surface stress for the
unreconstructed Au (111) in pH 2, 0.1 M NaF and Na 2 SO 4 solutions were reported
by Vasiljevic et al. [34]. Schmickler and Leiva [18] calculated the contribution of the
metal side to γ and g within the jellium model and found that the changes in g are
much larger than those in γ , indicating that the surface concentration of electrons
has a direct effect on the surface stress.
On the other hand, the maxima of the surface stress have been often observed
in the vs. E curves measured for a polycrystalline Au ribbon [35] or foil [36]
electrode, and for a vacuum-deposited [37] or sputtered [38] Au thin-film electrode.
Figure 1.11 shows the vs. E curve measured in the potential region between
−0.50 and 1.08 V (SHE) for a vacuum-deposited Au thin-film electrode in 0.1 M
1 Surface Thermodynamics of Solid Electrode
1.2
1.0
0.8
0.6
0.4
0.2
0.0
-0.2
q / C m
-2
0.8
0.4
0.0
E / V (SCE)
0.1 M HClO 4
0.1 M HClO 4 + 10
-5 M K 2 SO 4
0.1 M HClO 4 + 5 x10
-3 M K 2 SO 4
Au (111)
Fig. 1.8 Surface charge density versus potential (q vs. E) curves for an unreconstructed Au (111)
electrode in 0.1 M HClO 4 solutions without and with 10 −5 M, and 5 × 10 −3 M K 2 SO 4 [32].
Reprinted from [32], Copyright 1994, with permission from Elsevier
potential ((γ vs. E) curve is named “electrocapillary curve” for a solid electrode. In
this book, the name “surface stress versus potential curve” is employed to distinguish
from the electrocapillary curve ((γ vs. E) for a solid electrode.
The values of in the ordinate of Fig. 1.10 are arbitrarily referred to zero at
0.80 V (SHE). The surface stress keeps almost constant in the potential range of −
0.24 to 0.30 V (SHE), but it changes rapidly toward compressive direction ((g <
0) with increasing potential from 0.40 to 0.80 V (SHE). No clear maximum of the
surface stress like an electrocapillary maximum (ecm) in Figs. 1.6 and 1.9 is observed
in Fig. 1.10. As seen from the comparison in the same potential width between
Figs. 1.9 and 1.10, the changes in surface stress are several times as much as the
changes in surface tension. The similar results of the changes in surface stress for the
unreconstructed Au (111) in pH 2, 0.1 M NaF and Na 2 SO 4 solutions were reported
by Vasiljevic et al. [34]. Schmickler and Leiva [18] calculated the contribution of the
metal side to γ and g within the jellium model and found that the changes in g are
much larger than those in γ , indicating that the surface concentration of electrons
has a direct effect on the surface stress.
On the other hand, the maxima of the surface stress have been often observed
in the vs. E curves measured for a polycrystalline Au ribbon [35] or foil [36]
electrode, and for a vacuum-deposited [37] or sputtered [38] Au thin-film electrode.
Figure 1.11 shows the vs. E curve measured in the potential region between
−0.50 and 1.08 V (SHE) for a vacuum-deposited Au thin-film electrode in 0.1 M