

1.9 Electrocapillary Curves of Liquid and Solid Metal Electrodes
27
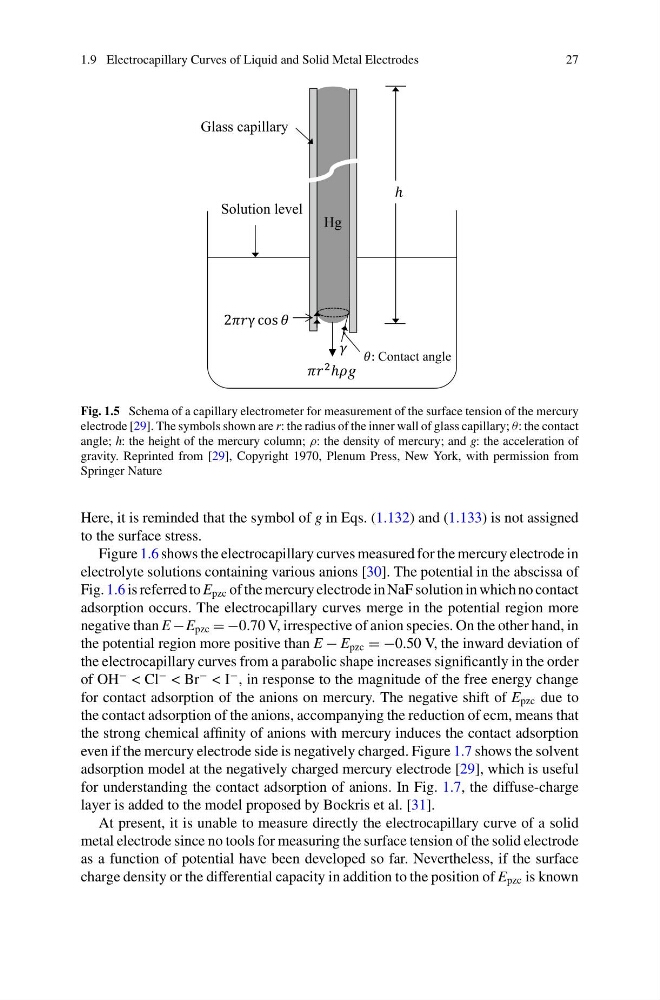
Fig. 1.5 Schema of a capillary electrometer for measurement of the surface tension of the mercury
electrode [29]. The symbols shown are r: the radius of the inner wall of glass capillary; θ: the contact
angle; h: the height of the mercury column; ρ: the density of mercury; and g: the acceleration of
gravity. Reprinted from [29], Copyright 1970, Plenum Press, New York, with permission from
Springer Nature
Here, it is reminded that the symbol of g in Eqs. (1.132) and (1.133) is not assigned
to the surface stress.
Figure 1.6 shows the electrocapillary curves measured for the mercury electrode in
electrolyte solutions containing various anions [30]. The potential in the abscissa of
Fig. 1.6 is referred to E pzc of the mercury electrode in NaF solution in which no contact
adsorption occurs. The electrocapillary curves merge in the potential region more
negative than E −E pzc = −0.70 V, irrespective of anion species. On the other hand, in
the potential region more positive than E − E pzc = −0.50 V, the inward deviation of
the electrocapillary curves from a parabolic shape increases significantly in the order
of OH
− < Cl
− < Br
− < I
− , in response to the magnitude of the free energy change
for contact adsorption of the anions on mercury. The negative shift of E pzc due to
the contact adsorption of the anions, accompanying the reduction of ecm, means that
the strong chemical affinity of anions with mercury induces the contact adsorption
even if the mercury electrode side is negatively charged. Figure 1.7 shows the solvent
adsorption model at the negatively charged mercury electrode [29], which is useful
for understanding the contact adsorption of anions. In Fig. 1.7, the diffuse-charge
layer is added to the model proposed by Bockris et al. [31].
At present, it is unable to measure directly the electrocapillary curve of a solid
metal electrode since no tools for measuring the surface tension of the solid electrode
as a function of potential have been developed so far. Nevertheless, if the surface
charge density or the differential capacity in addition to the position of E pzc is known
27
Fig. 1.5 Schema of a capillary electrometer for measurement of the surface tension of the mercury
electrode [29]. The symbols shown are r: the radius of the inner wall of glass capillary; θ: the contact
angle; h: the height of the mercury column; ρ: the density of mercury; and g: the acceleration of
gravity. Reprinted from [29], Copyright 1970, Plenum Press, New York, with permission from
Springer Nature
Here, it is reminded that the symbol of g in Eqs. (1.132) and (1.133) is not assigned
to the surface stress.
Figure 1.6 shows the electrocapillary curves measured for the mercury electrode in
electrolyte solutions containing various anions [30]. The potential in the abscissa of
Fig. 1.6 is referred to E pzc of the mercury electrode in NaF solution in which no contact
adsorption occurs. The electrocapillary curves merge in the potential region more
negative than E −E pzc = −0.70 V, irrespective of anion species. On the other hand, in
the potential region more positive than E − E pzc = −0.50 V, the inward deviation of
the electrocapillary curves from a parabolic shape increases significantly in the order
of OH
− < Cl
− < Br
− < I
− , in response to the magnitude of the free energy change
for contact adsorption of the anions on mercury. The negative shift of E pzc due to
the contact adsorption of the anions, accompanying the reduction of ecm, means that
the strong chemical affinity of anions with mercury induces the contact adsorption
even if the mercury electrode side is negatively charged. Figure 1.7 shows the solvent
adsorption model at the negatively charged mercury electrode [29], which is useful
for understanding the contact adsorption of anions. In Fig. 1.7, the diffuse-charge
layer is added to the model proposed by Bockris et al. [31].
At present, it is unable to measure directly the electrocapillary curve of a solid
metal electrode since no tools for measuring the surface tension of the solid electrode
as a function of potential have been developed so far. Nevertheless, if the surface
charge density or the differential capacity in addition to the position of E pzc is known