

192
7 Nano-Mechanical Properties of Solid Surfaces Obtained …
30
25
20
15
10
5
0
Hardness,
H / GPa
100
80
60
40
20
0
Contact depth, h c / nm
Nb-doped TiO 2 (001)
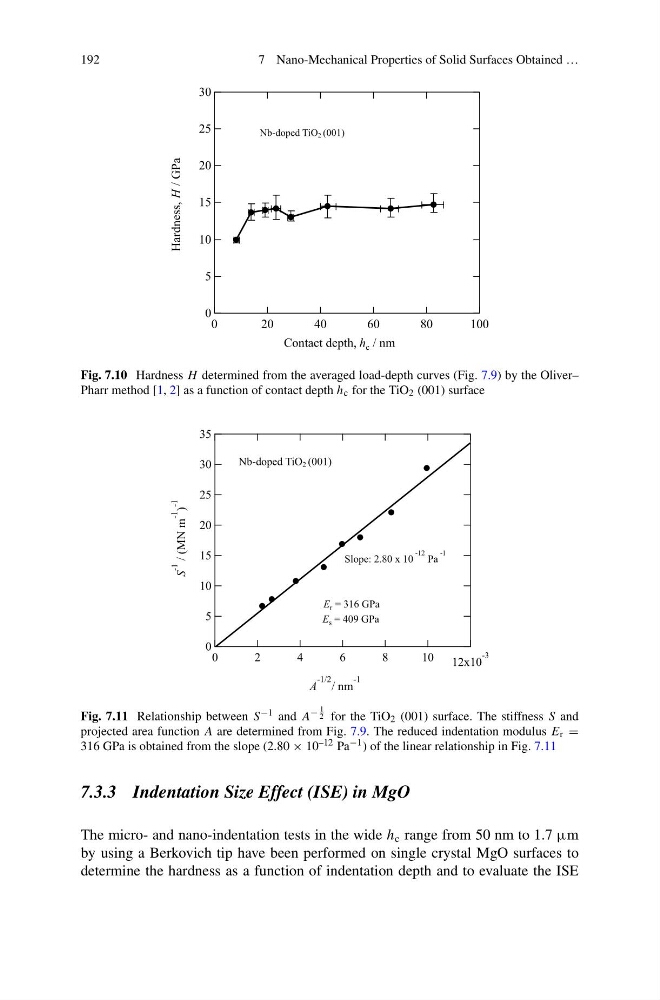
Fig. 7.10 Hardness H determined from the averaged load-depth curves (Fig. 7.9) by the Oliver–
Pharr method [1, 2] as a function of contact depth h c for the TiO 2 (001) surface
35
30
25
20
15
10
5
0
S
-1
/ (MN m
-1
)
-1
12x10
-3
10
8
6
4
2
0
A
-1/2 / nm
-1
Slope: 2.80 x 10
-12 Pa
-1
E r = 316 GPa
E s = 409 GPa
Nb-doped TiO 2 (001)
Fig. 7.11 Relationship between S −1 and A
−
1
2 for the TiO 2 (001) surface. The stiffness S and
projected area function A are determined from Fig. 7.9. The reduced indentation modulus E r =
316 GPa is obtained from the slope (2.80 × 10 –12 Pa −1 ) of the linear relationship in Fig. 7.11
7.3.3 Indentation Size Effect (ISE) in MgO
The micro- and nano-indentation tests in the wide h c range from 50 nm to 1.7 µm
by using a Berkovich tip have been performed on single crystal MgO surfaces to
determine the hardness as a function of indentation depth and to evaluate the ISE
7 Nano-Mechanical Properties of Solid Surfaces Obtained …
30
25
20
15
10
5
0
Hardness,
H / GPa
100
80
60
40
20
0
Contact depth, h c / nm
Nb-doped TiO 2 (001)
Fig. 7.10 Hardness H determined from the averaged load-depth curves (Fig. 7.9) by the Oliver–
Pharr method [1, 2] as a function of contact depth h c for the TiO 2 (001) surface
35
30
25
20
15
10
5
0
S
-1
/ (MN m
-1
)
-1
12x10
-3
10
8
6
4
2
0
A
-1/2 / nm
-1
Slope: 2.80 x 10
-12 Pa
-1
E r = 316 GPa
E s = 409 GPa
Nb-doped TiO 2 (001)
Fig. 7.11 Relationship between S −1 and A
−
1
2 for the TiO 2 (001) surface. The stiffness S and
projected area function A are determined from Fig. 7.9. The reduced indentation modulus E r =
316 GPa is obtained from the slope (2.80 × 10 –12 Pa −1 ) of the linear relationship in Fig. 7.11
7.3.3 Indentation Size Effect (ISE) in MgO
The micro- and nano-indentation tests in the wide h c range from 50 nm to 1.7 µm
by using a Berkovich tip have been performed on single crystal MgO surfaces to
determine the hardness as a function of indentation depth and to evaluate the ISE