

4.3 Changes in Surface Stress during UPD
109
4.3.1 Pb-UPD on Au (111)
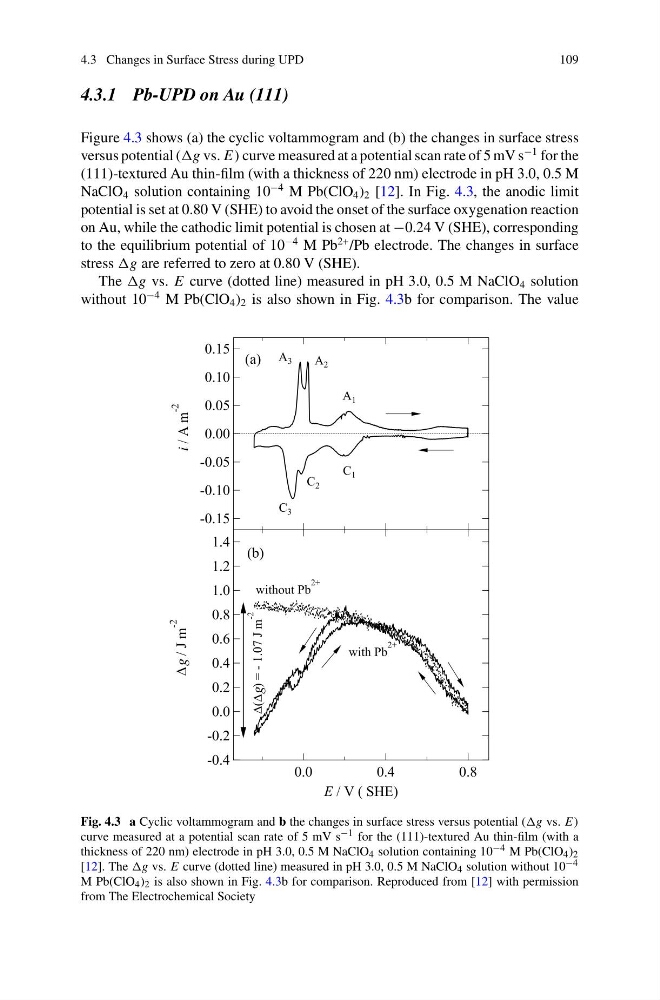
Figure 4.3 shows (a) the cyclic voltammogram and (b) the changes in surface stress
versus potential ( vs. E) curve measured at a potential scan rate of 5 mV s
−1 for the
(111)-textured Au thin-film (with a thickness of 220 nm) electrode in pH 3.0, 0.5 M
NaClO 4 solution containing 10
−4 M Pb(ClO 4 ) 2 [12]. In Fig. 4.3, the anodic limit
potential is set at 0.80 V (SHE) to avoid the onset of the surface oxygenation reaction
on Au, while the cathodic limit potential is chosen at −0.24 V (SHE), corresponding
to the equilibrium potential of 10
−4 M Pb
2+ /Pb electrode. The changes in surface
stress are referred to zero at 0.80 V (SHE).
The vs. E curve (dotted line) measured in pH 3.0, 0.5 M NaClO 4 solution
without 10
−4 M Pb(ClO 4 ) 2 is also shown in Fig. 4.3b for comparison. The value
Fig. 4.3 a Cyclic voltammogram and b the changes in surface stress versus potential ( vs. E)
curve measured at a potential scan rate of 5 mV s −1 for the (111)-textured Au thin-film (with a
thickness of 220 nm) electrode in pH 3.0, 0.5 M NaClO 4 solution containing 10 −4 M Pb(ClO 4 ) 2
[12]. The vs. E curve (dotted line) measured in pH 3.0, 0.5 M NaClO 4 solution without 10 −4
M Pb(ClO 4 ) 2 is also shown in Fig. 4.3b for comparison. Reproduced from [12] with permission
from The Electrochemical Society
109
4.3.1 Pb-UPD on Au (111)
Figure 4.3 shows (a) the cyclic voltammogram and (b) the changes in surface stress
versus potential ( vs. E) curve measured at a potential scan rate of 5 mV s
−1 for the
(111)-textured Au thin-film (with a thickness of 220 nm) electrode in pH 3.0, 0.5 M
NaClO 4 solution containing 10
−4 M Pb(ClO 4 ) 2 [12]. In Fig. 4.3, the anodic limit
potential is set at 0.80 V (SHE) to avoid the onset of the surface oxygenation reaction
on Au, while the cathodic limit potential is chosen at −0.24 V (SHE), corresponding
to the equilibrium potential of 10
−4 M Pb
2+ /Pb electrode. The changes in surface
stress are referred to zero at 0.80 V (SHE).
The vs. E curve (dotted line) measured in pH 3.0, 0.5 M NaClO 4 solution
without 10
−4 M Pb(ClO 4 ) 2 is also shown in Fig. 4.3b for comparison. The value
Fig. 4.3 a Cyclic voltammogram and b the changes in surface stress versus potential ( vs. E)
curve measured at a potential scan rate of 5 mV s −1 for the (111)-textured Au thin-film (with a
thickness of 220 nm) electrode in pH 3.0, 0.5 M NaClO 4 solution containing 10 −4 M Pb(ClO 4 ) 2
[12]. The vs. E curve (dotted line) measured in pH 3.0, 0.5 M NaClO 4 solution without 10 −4
M Pb(ClO 4 ) 2 is also shown in Fig. 4.3b for comparison. Reproduced from [12] with permission
from The Electrochemical Society