

92
3 Potential- or Adsorbate-Induced Changes in Surface Stress …
a strain frequency of 20 Hz with a strain amplitude of ε o = 2 × 10
−4 for a (111)textured Au thin-film electrode in 0.01 M HClO 4 solution [42]. The delay resistance
R D = 50 k is employed for the experiment of Fig. 3.13, which exhibits only
minor difference in cyclic voltammogram at 1 mV s
−1 . In Fig. 3.13b, the value of
ζ E,ε with minus sign depends on potential, taking a minimum at E = 0.53 V (SHE)
although it exhibits a small hysteresis. The potential dependence of ζ E,ε obtained
by the potential–strain response coincided with that obtained by the current–strain
response except for the slight difference in hysteresis [42]. The potential at which
ζ E,ε takes the minimum is close to the potential of zero charge E pzc = 0.48 V (SHE)
for the Au (111) electrode in HClO 4 solution [36]. The minimum value of ζ E,ε =
−1.9 ± 0.2 V agrees with that (ζ E,ε = −1.83 V) obtained by the potential–strain
response under open-circuit condition [43].
Moreover, the minimum value of ζ E,ε coincides with ζ g,q = −2.0 V obtained at
near E pzc by a cantilever bending method [35], proving experimentally that ζ E,ε is
equivalent to ζ g,q . It has been also found that there are no significant differences
between the ζ E,ε versus E curves obtained in 10
−3 M ~ 0.1 M HClO 4 and H 2 SO 4
solutions, using strain cycles with a frequency of 20 Hz and an amplitude of ε o =
2 × 10
−4 , indicating that ζ E,ε or ζ g,q is essentially independent of the electrolyte
anion species and of the solution concentration, which may mean that ζ E,ε or ζ g,q
is linked directly to the electronic process of the metal surface such as band-filling
by the excess surface charge [37, 42]. The ζ E,ε versus E curve in Fig. 3.13b exhibits
not only a minimum at 0.53 V but also a shoulder at about 0.8 V and an inversion in
slope at about 1.0 V (SHE).
3.4.4 Sign-Reversal of ζ g,q in the Hydrogen
Adsorption/Desorption Region or in the Oxide
Formation/Reduction Region
The sign-reversals of the potential dependence of surface stress
∂g
∂ E
in the hydrogen
adsorption/desorption region and in the oxide formation/reduction region have been
qualitatively observed for polycrystalline Pt [44, 45] and Pd [46, 47] foil electrodes in sulfate solutions with different pH values and in perchloric acids with
different concentrations of chloride ions by using a piezoelectric technique similar
to Gokhshtein’s estance method [34]. The following relationship between ζ g,q and
∂g
∂ E
holds:
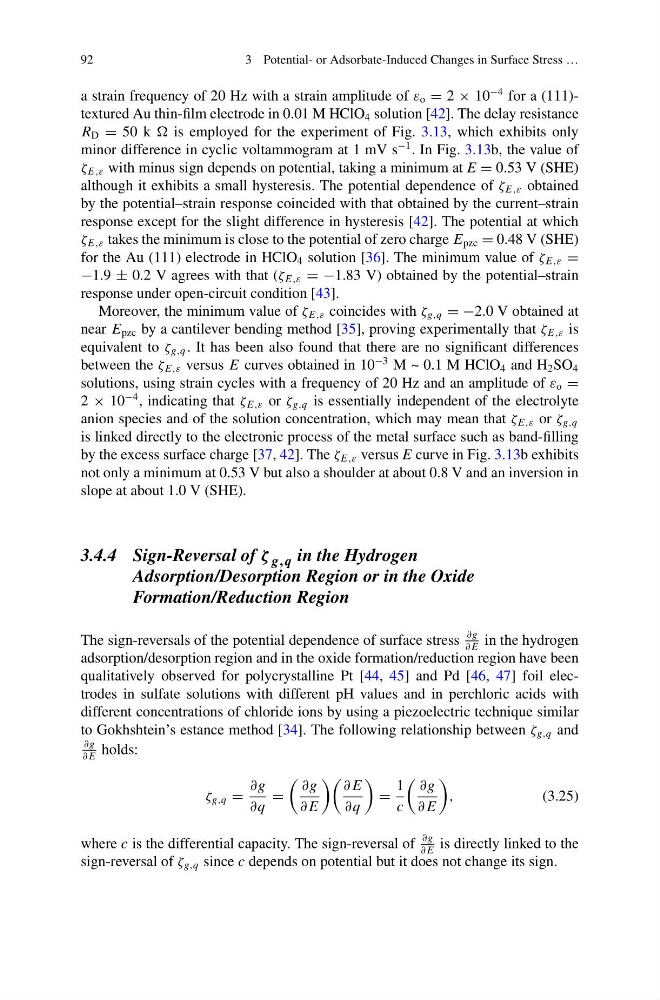
ζ g,q =
∂g
∂q
=
∂g
∂ E
∂ E
∂q
=
1
c
∂g
∂ E
,
(3.25)
where c is the differential capacity. The sign-reversal of
∂g
∂ E
is directly linked to the
sign-reversal of ζ g,q since c depends on potential but it does not change its sign.
3 Potential- or Adsorbate-Induced Changes in Surface Stress …
a strain frequency of 20 Hz with a strain amplitude of ε o = 2 × 10
−4 for a (111)textured Au thin-film electrode in 0.01 M HClO 4 solution [42]. The delay resistance
R D = 50 k is employed for the experiment of Fig. 3.13, which exhibits only
minor difference in cyclic voltammogram at 1 mV s
−1 . In Fig. 3.13b, the value of
ζ E,ε with minus sign depends on potential, taking a minimum at E = 0.53 V (SHE)
although it exhibits a small hysteresis. The potential dependence of ζ E,ε obtained
by the potential–strain response coincided with that obtained by the current–strain
response except for the slight difference in hysteresis [42]. The potential at which
ζ E,ε takes the minimum is close to the potential of zero charge E pzc = 0.48 V (SHE)
for the Au (111) electrode in HClO 4 solution [36]. The minimum value of ζ E,ε =
−1.9 ± 0.2 V agrees with that (ζ E,ε = −1.83 V) obtained by the potential–strain
response under open-circuit condition [43].
Moreover, the minimum value of ζ E,ε coincides with ζ g,q = −2.0 V obtained at
near E pzc by a cantilever bending method [35], proving experimentally that ζ E,ε is
equivalent to ζ g,q . It has been also found that there are no significant differences
between the ζ E,ε versus E curves obtained in 10
−3 M ~ 0.1 M HClO 4 and H 2 SO 4
solutions, using strain cycles with a frequency of 20 Hz and an amplitude of ε o =
2 × 10
−4 , indicating that ζ E,ε or ζ g,q is essentially independent of the electrolyte
anion species and of the solution concentration, which may mean that ζ E,ε or ζ g,q
is linked directly to the electronic process of the metal surface such as band-filling
by the excess surface charge [37, 42]. The ζ E,ε versus E curve in Fig. 3.13b exhibits
not only a minimum at 0.53 V but also a shoulder at about 0.8 V and an inversion in
slope at about 1.0 V (SHE).
3.4.4 Sign-Reversal of ζ g,q in the Hydrogen
Adsorption/Desorption Region or in the Oxide
Formation/Reduction Region
The sign-reversals of the potential dependence of surface stress
∂g
∂ E
in the hydrogen
adsorption/desorption region and in the oxide formation/reduction region have been
qualitatively observed for polycrystalline Pt [44, 45] and Pd [46, 47] foil electrodes in sulfate solutions with different pH values and in perchloric acids with
different concentrations of chloride ions by using a piezoelectric technique similar
to Gokhshtein’s estance method [34]. The following relationship between ζ g,q and
∂g
∂ E
holds:
ζ g,q =
∂g
∂q
=
∂g
∂ E
∂ E
∂q
=
1
c
∂g
∂ E
,
(3.25)
where c is the differential capacity. The sign-reversal of
∂g
∂ E
is directly linked to the
sign-reversal of ζ g,q since c depends on potential but it does not change its sign.