

3.4 Surface Stress Versus Surface Charge Density or Potential …
91
The value of
ζ E,ε
can be eventually obtained from Eq. (3.24) by measuring I o in the
current–strain response (DECMA) experiment (see Fig. 2.16a in Sect. 2.4 of Chap. 2)
and by combining |Z e | determined with separate EIS experiments under identical
conditions with the DECMA experiment [42]. The sign of ζ E,ε can be determined
from the phase angle ψ.
Alternatively, apart from the current–strain response experiment, ζ E,ε can be
measured directly by the potential–strain response in connection of a delay resistance
R D in series with the working electrode without the need of separate EIS experiment
[42] (see Fig. 2.16b in Sect. 2.4 of Chap. 2). The addition of R D to the uncompensated solution resistance r sol increases the time constant for potential control at the
working electrode, which lowers the performance of the potentiostat compensating
the potential variation due to the cyclic strain. As a result, the strain-induced potential
variation can be measured by a lock-in amplifier connected between the working and
reference electrodes. For a typical electrode with a capacity of 100 µF, the addition
of R D = 50 k yields the time constant of about 5 s, much longer than the cycle
time (e.g., 0.05 s for 20 Hz) of elastic strain but much shorter than the time (e.g., 10
3
s V
−1 for 1 mV s
−1 ) to complete a sufficiently slow voltammogram [42].
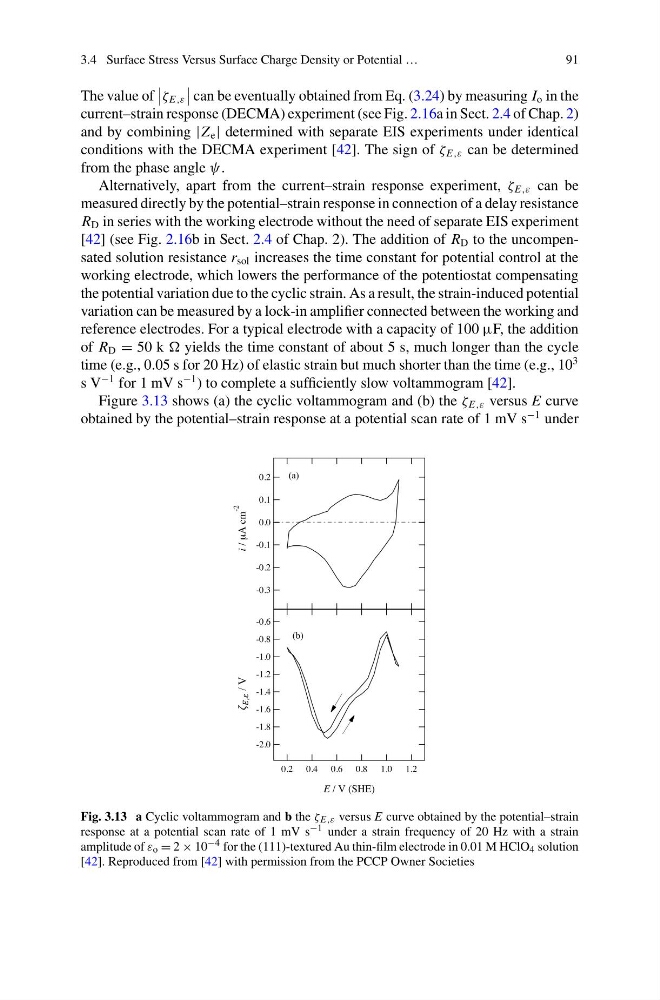
Figure 3.13 shows (a) the cyclic voltammogram and (b) the ζ E,ε versus E curve
obtained by the potential–strain response at a potential scan rate of 1 mV s
−1 under
Fig. 3.13 a Cyclic voltammogram and b the ζ E,ε versus E curve obtained by the potential–strain
response at a potential scan rate of 1 mV s −1 under a strain frequency of 20 Hz with a strain
amplitude of ε o = 2 × 10 −4 for the (111)-textured Au thin-film electrode in 0.01 M HClO 4 solution
[42]. Reproduced from [42] with permission from the PCCP Owner Societies
91
The value of
ζ E,ε
can be eventually obtained from Eq. (3.24) by measuring I o in the
current–strain response (DECMA) experiment (see Fig. 2.16a in Sect. 2.4 of Chap. 2)
and by combining |Z e | determined with separate EIS experiments under identical
conditions with the DECMA experiment [42]. The sign of ζ E,ε can be determined
from the phase angle ψ.
Alternatively, apart from the current–strain response experiment, ζ E,ε can be
measured directly by the potential–strain response in connection of a delay resistance
R D in series with the working electrode without the need of separate EIS experiment
[42] (see Fig. 2.16b in Sect. 2.4 of Chap. 2). The addition of R D to the uncompensated solution resistance r sol increases the time constant for potential control at the
working electrode, which lowers the performance of the potentiostat compensating
the potential variation due to the cyclic strain. As a result, the strain-induced potential
variation can be measured by a lock-in amplifier connected between the working and
reference electrodes. For a typical electrode with a capacity of 100 µF, the addition
of R D = 50 k yields the time constant of about 5 s, much longer than the cycle
time (e.g., 0.05 s for 20 Hz) of elastic strain but much shorter than the time (e.g., 10
3
s V
−1 for 1 mV s
−1 ) to complete a sufficiently slow voltammogram [42].
Figure 3.13 shows (a) the cyclic voltammogram and (b) the ζ E,ε versus E curve
obtained by the potential–strain response at a potential scan rate of 1 mV s
−1 under
Fig. 3.13 a Cyclic voltammogram and b the ζ E,ε versus E curve obtained by the potential–strain
response at a potential scan rate of 1 mV s −1 under a strain frequency of 20 Hz with a strain
amplitude of ε o = 2 × 10 −4 for the (111)-textured Au thin-film electrode in 0.01 M HClO 4 solution
[42]. Reproduced from [42] with permission from the PCCP Owner Societies