

208
7 Nano-Mechanical Properties of Solid Surfaces Obtained …
areas hatched with dark- and light-gray colors, respectively, in the schematic loaddepth curve [52]. From the finite element simulations [62–65] of many elastic–plastic
materials with different work-hardening behaviors for pile-up during indentation, it
is deduced that the work ratio of W e to W t is a unique function of the ratio of reduced
modulus E r to hardness H , independent of the work-hardening behavior. Although
the presented results are only in graphical form, the following relationship [2] can
be approximated:
W e
W t
∼ = 5
H
E r
.
(7.36)
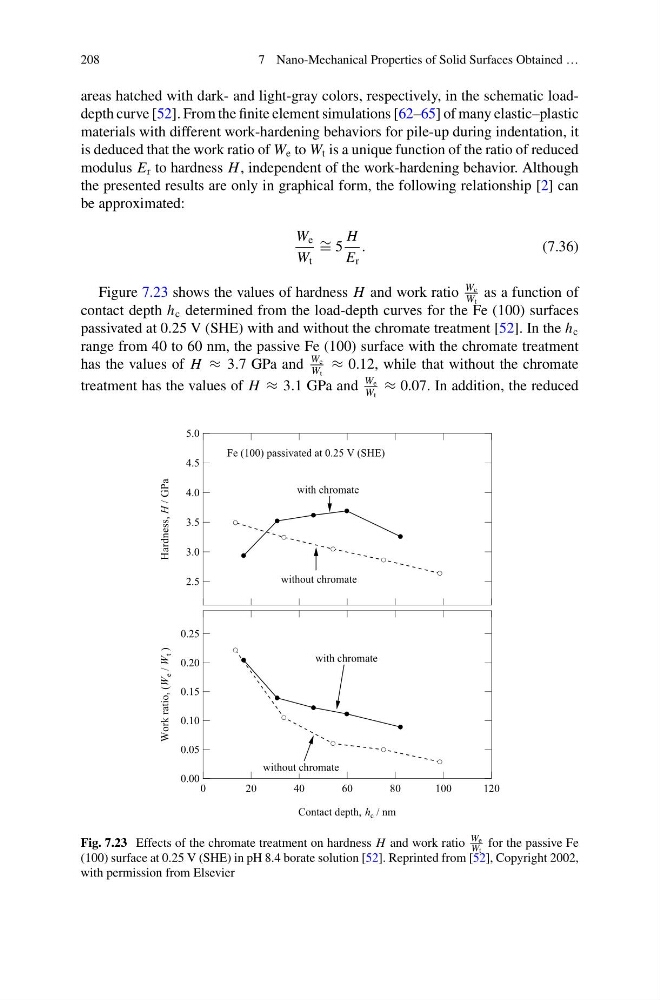
Figure 7.23 shows the values of hardness H and work ratio
W e
W t
as a function of
contact depth h c determined from the load-depth curves for the Fe (100) surfaces
passivated at 0.25 V (SHE) with and without the chromate treatment [52]. In the h c
range from 40 to 60 nm, the passive Fe (100) surface with the chromate treatment
has the values of H ≈ 3.7 GPa and
W e
W t
≈ 0.12, while that without the chromate
treatment has the values of H ≈ 3.1 GPa and
W e
W t
≈ 0.07. In addition, the reduced
0.25
0.20
0.15
0.10
0.05
0.00
Work ratio, (W
e /
W
t )
120
100
80
60
40
20
0
Contact depth, h c / nm
with chromate
without chromate
5.0
4.5
4.0
3.5
3.0
2.5
Hardness,
H / GPa
Fe (100) passivated at 0.25 V (SHE)
with chromate
without chromate
Fig. 7.23 Effects of the chromate treatment on hardness H and work ratio
We
Wt for the passive Fe
(100) surface at 0.25 V (SHE) in pH 8.4 borate solution [52]. Reprinted from [52], Copyright 2002,
with permission from Elsevier
7 Nano-Mechanical Properties of Solid Surfaces Obtained …
areas hatched with dark- and light-gray colors, respectively, in the schematic loaddepth curve [52]. From the finite element simulations [62–65] of many elastic–plastic
materials with different work-hardening behaviors for pile-up during indentation, it
is deduced that the work ratio of W e to W t is a unique function of the ratio of reduced
modulus E r to hardness H , independent of the work-hardening behavior. Although
the presented results are only in graphical form, the following relationship [2] can
be approximated:
W e
W t
∼ = 5
H
E r
.
(7.36)
Figure 7.23 shows the values of hardness H and work ratio
W e
W t
as a function of
contact depth h c determined from the load-depth curves for the Fe (100) surfaces
passivated at 0.25 V (SHE) with and without the chromate treatment [52]. In the h c
range from 40 to 60 nm, the passive Fe (100) surface with the chromate treatment
has the values of H ≈ 3.7 GPa and
W e
W t
≈ 0.12, while that without the chromate
treatment has the values of H ≈ 3.1 GPa and
W e
W t
≈ 0.07. In addition, the reduced
0.25
0.20
0.15
0.10
0.05
0.00
Work ratio, (W
e /
W
t )
120
100
80
60
40
20
0
Contact depth, h c / nm
with chromate
without chromate
5.0
4.5
4.0
3.5
3.0
2.5
Hardness,
H / GPa
Fe (100) passivated at 0.25 V (SHE)
with chromate
without chromate
Fig. 7.23 Effects of the chromate treatment on hardness H and work ratio
We
Wt for the passive Fe
(100) surface at 0.25 V (SHE) in pH 8.4 borate solution [52]. Reprinted from [52], Copyright 2002,
with permission from Elsevier