

268
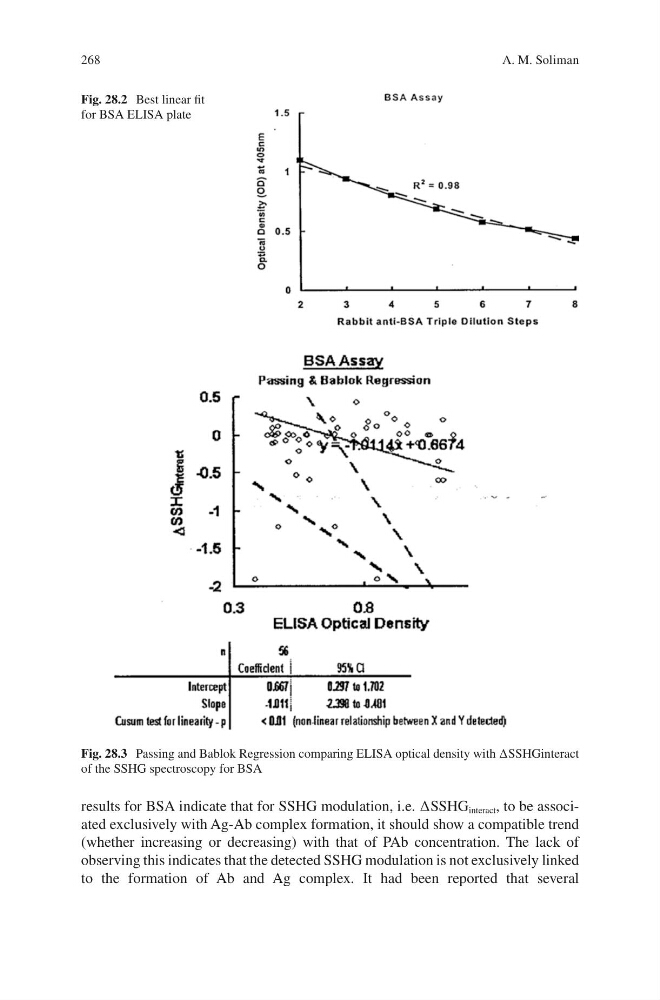
results for BSA indicate that for SSHG modulation, i.e. ∆SSHG interact , to be associated exclusively with Ag-Ab complex formation, it should show a compatible trend
(whether increasing or decreasing) with that of PAb concentration. The lack of
observing this indicates that the detected SSHG modulation is not exclusively linked
to the formation of Ab and Ag complex. It had been reported that several
Fig. 28.2 Best linear fit
for BSA ELISA plate
Fig. 28.3 Passing and Bablok Regression comparing ELISA optical density with ∆SSHGinteract
of the SSHG spectroscopy for BSA
A. M. Soliman
results for BSA indicate that for SSHG modulation, i.e. ∆SSHG interact , to be associated exclusively with Ag-Ab complex formation, it should show a compatible trend
(whether increasing or decreasing) with that of PAb concentration. The lack of
observing this indicates that the detected SSHG modulation is not exclusively linked
to the formation of Ab and Ag complex. It had been reported that several
Fig. 28.2 Best linear fit
for BSA ELISA plate
Fig. 28.3 Passing and Bablok Regression comparing ELISA optical density with ∆SSHGinteract
of the SSHG spectroscopy for BSA
A. M. Soliman