

267
3. Compute SSHG modulation due to the biomolecular interaction denoted as
∆SSHG interact. = SSHG pb -SSHG wd .
4. Apply Passing and Bablok Regression analysis to compare ∆SSHG interact values
to their corresponding enzyme-linked ODs values to examine agreement between
the two test methods.
5. Application of SSHG Spectroscopy to BSA using eight replicates of the optimised ELISA BSA plates.
28.2 Results
28.2.1 SSHG Spectroscopy for BSA Model
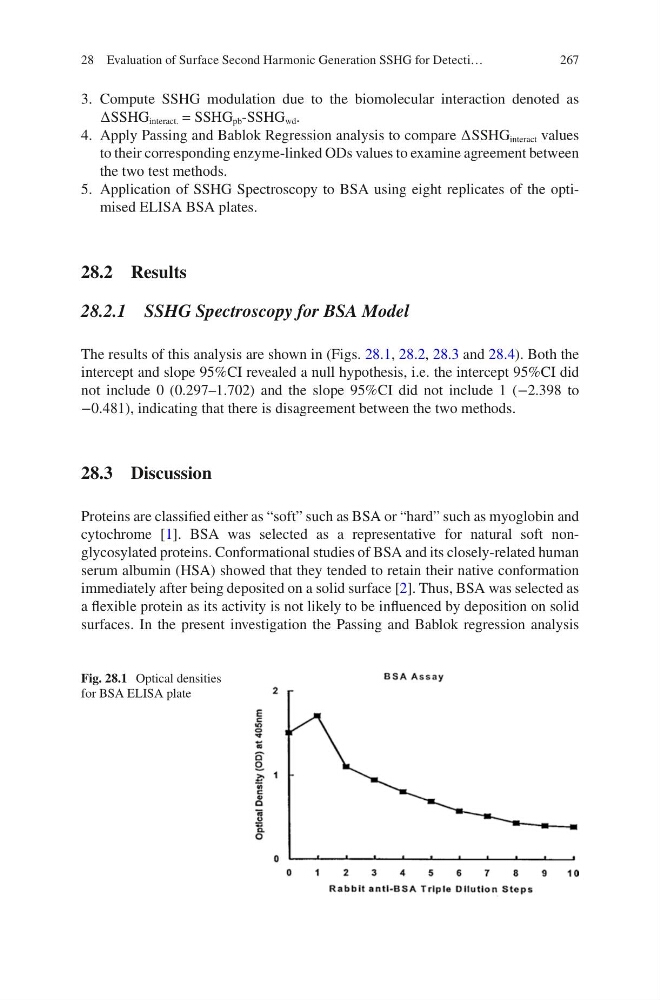
The results of this analysis are shown in (Figs. 28.1, 28.2, 28.3 and 28.4). Both the
intercept and slope 95%CI revealed a null hypothesis, i.e. the intercept 95%CI did
not include 0 (0.297–1.702) and the slope 95%CI did not include 1 (−2.398 to
−0.481), indicating that there is disagreement between the two methods.
28.3 Discussion
Proteins are classified either as “soft” such as BSA or “hard” such as myoglobin and
cytochrome [1]. BSA was selected as a representative for natural soft nonglycosylated proteins. Conformational studies of BSA and its closely-related human
serum albumin (HSA) showed that they tended to retain their native conformation
immediately after being deposited on a solid surface [2]. Thus, BSA was selected as
a flexible protein as its activity is not likely to be influenced by deposition on solid
surfaces. In the present investigation the Passing and Bablok regression analysis
Fig. 28.1 Optical densities
for BSA ELISA plate
28 Evaluation of Surface Second Harmonic Generation SSHG for Detecti…
3. Compute SSHG modulation due to the biomolecular interaction denoted as
∆SSHG interact. = SSHG pb -SSHG wd .
4. Apply Passing and Bablok Regression analysis to compare ∆SSHG interact values
to their corresponding enzyme-linked ODs values to examine agreement between
the two test methods.
5. Application of SSHG Spectroscopy to BSA using eight replicates of the optimised ELISA BSA plates.
28.2 Results
28.2.1 SSHG Spectroscopy for BSA Model
The results of this analysis are shown in (Figs. 28.1, 28.2, 28.3 and 28.4). Both the
intercept and slope 95%CI revealed a null hypothesis, i.e. the intercept 95%CI did
not include 0 (0.297–1.702) and the slope 95%CI did not include 1 (−2.398 to
−0.481), indicating that there is disagreement between the two methods.
28.3 Discussion
Proteins are classified either as “soft” such as BSA or “hard” such as myoglobin and
cytochrome [1]. BSA was selected as a representative for natural soft nonglycosylated proteins. Conformational studies of BSA and its closely-related human
serum albumin (HSA) showed that they tended to retain their native conformation
immediately after being deposited on a solid surface [2]. Thus, BSA was selected as
a flexible protein as its activity is not likely to be influenced by deposition on solid
surfaces. In the present investigation the Passing and Bablok regression analysis
Fig. 28.1 Optical densities
for BSA ELISA plate
28 Evaluation of Surface Second Harmonic Generation SSHG for Detecti…