

214
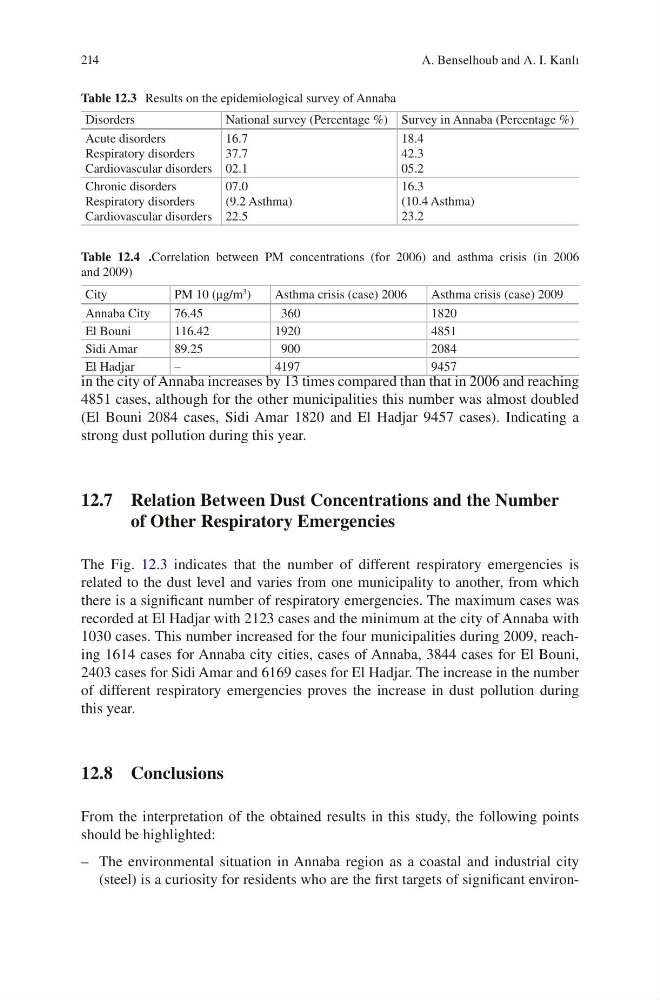
in the city of Annaba increases by 13 times compared than that in 2006 and reaching
4851 cases, although for the other municipalities this number was almost doubled
(El Bouni 2084 cases, Sidi Amar 1820 and El Hadjar 9457 cases). Indicating a
strong dust pollution during this year.
12.7 Relation Between Dust Concentrations and the Number
of Other Respiratory Emergencies
The Fig. 12.3 indicates that the number of different respiratory emergencies is
related to the dust level and varies from one municipality to another, from which
there is a significant number of respiratory emergencies. The maximum cases was
recorded at El Hadjar with 2123 cases and the minimum at the city of Annaba with
1030 cases. This number increased for the four municipalities during 2009, reaching 1614 cases for Annaba city cities, cases of Annaba, 3844 cases for El Bouni,
2403 cases for Sidi Amar and 6169 cases for El Hadjar. The increase in the number
of different respiratory emergencies proves the increase in dust pollution during
this year.
12.8 Conclusions
From the interpretation of the obtained results in this study, the following points
should be highlighted:
– The environmental situation in Annaba region as a coastal and industrial city
(steel) is a curiosity for residents who are the first targets of significant environTable 12.3 Results on the epidemiological survey of Annaba
Disorders
National survey (Percentage %) Survey in Annaba (Percentage %)
Acute disorders
Respiratory disorders
Cardiovascular disorders
16.7
37.7
02.1
18.4
42.3
05.2
Chronic disorders
Respiratory disorders
Cardiovascular disorders
07.0
(9.2 Asthma)
22.5
16.3
(10.4 Asthma)
23.2
Table 12.4 .Correlation between PM concentrations (for 2006) and asthma crisis (in 2006
and 2009)
City
PM 10 (μg/m
3 )
Asthma crisis (case) 2006
Asthma crisis (case) 2009
Annaba City
76.45
360
1820
El Bouni
116.42
1920
4851
Sidi Amar
89.25
900
2084
El Hadjar
–
4197
9457
A. Benselhoub and A. I. Kanlı
in the city of Annaba increases by 13 times compared than that in 2006 and reaching
4851 cases, although for the other municipalities this number was almost doubled
(El Bouni 2084 cases, Sidi Amar 1820 and El Hadjar 9457 cases). Indicating a
strong dust pollution during this year.
12.7 Relation Between Dust Concentrations and the Number
of Other Respiratory Emergencies
The Fig. 12.3 indicates that the number of different respiratory emergencies is
related to the dust level and varies from one municipality to another, from which
there is a significant number of respiratory emergencies. The maximum cases was
recorded at El Hadjar with 2123 cases and the minimum at the city of Annaba with
1030 cases. This number increased for the four municipalities during 2009, reaching 1614 cases for Annaba city cities, cases of Annaba, 3844 cases for El Bouni,
2403 cases for Sidi Amar and 6169 cases for El Hadjar. The increase in the number
of different respiratory emergencies proves the increase in dust pollution during
this year.
12.8 Conclusions
From the interpretation of the obtained results in this study, the following points
should be highlighted:
– The environmental situation in Annaba region as a coastal and industrial city
(steel) is a curiosity for residents who are the first targets of significant environTable 12.3 Results on the epidemiological survey of Annaba
Disorders
National survey (Percentage %) Survey in Annaba (Percentage %)
Acute disorders
Respiratory disorders
Cardiovascular disorders
16.7
37.7
02.1
18.4
42.3
05.2
Chronic disorders
Respiratory disorders
Cardiovascular disorders
07.0
(9.2 Asthma)
22.5
16.3
(10.4 Asthma)
23.2
Table 12.4 .Correlation between PM concentrations (for 2006) and asthma crisis (in 2006
and 2009)
City
PM 10 (μg/m
3 )
Asthma crisis (case) 2006
Asthma crisis (case) 2009
Annaba City
76.45
360
1820
El Bouni
116.42
1920
4851
Sidi Amar
89.25
900
2084
El Hadjar
–
4197
9457
A. Benselhoub and A. I. Kanlı