

125
an order of magnitude. Not only does this lead to “sharper” IMS images, but it also
allows prediction of ion distributions in areas not measured with IMS as well as
enrichment of biological signals and attenuation of instrumental artifacts. Some
dimensionality reduction methods discussed above, such as PCA, can help attenuate
such artifacts, but since those are only done with IMS images, they can only identify
IMS-related instrumental artifacts. By fusing multiple modalities, attenuation of
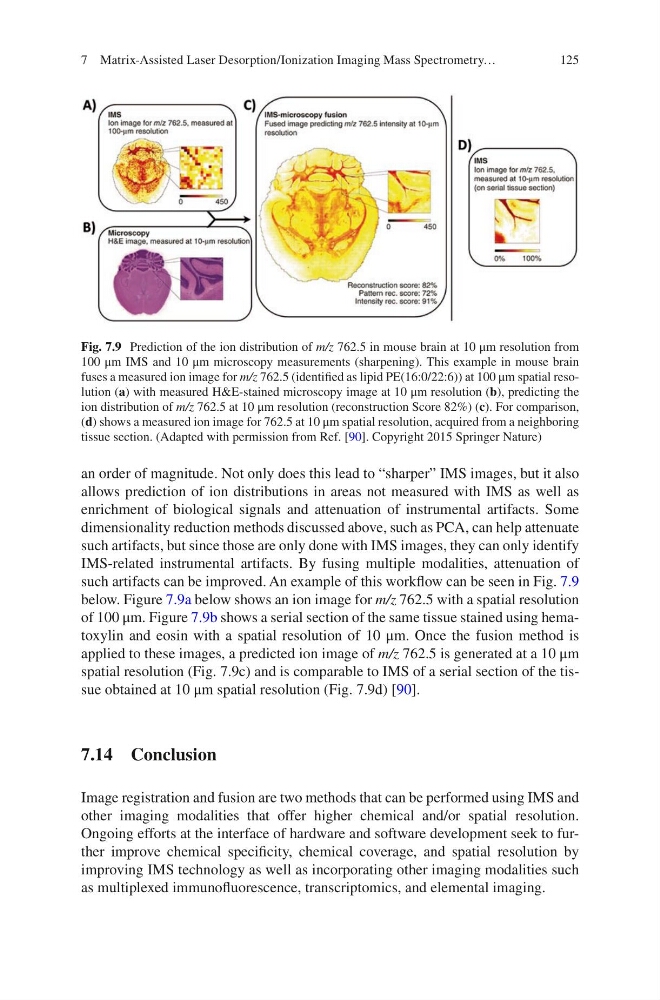
such artifacts can be improved. An example of this workflow can be seen in Fig. 7.9
below. Figure 7.9a below shows an ion image for m/z 762.5 with a spatial resolution
of 100 μm. Figure 7.9b shows a serial section of the same tissue stained using hematoxylin and eosin with a spatial resolution of 10 μm. Once the fusion method is
applied to these images, a predicted ion image of m/z 762.5 is generated at a 10 μm
spatial resolution (Fig. 7.9c) and is comparable to IMS of a serial section of the tissue obtained at 10 μm spatial resolution (Fig. 7.9d) [90].
7.14 Conclusion
Image registration and fusion are two methods that can be performed using IMS and
other imaging modalities that offer higher chemical and/or spatial resolution.
Ongoing efforts at the interface of hardware and software development seek to further improve chemical specificity, chemical coverage, and spatial resolution by
improving IMS technology as well as incorporating other imaging modalities such
as multiplexed immunofluorescence, transcriptomics, and elemental imaging.
Fig. 7.9 Prediction of the ion distribution of m/z 762.5 in mouse brain at 10 μm resolution from
100 μm IMS and 10 μm microscopy measurements (sharpening). This example in mouse brain
fuses a measured ion image for m/z 762.5 (identified as lipid PE(16:0/22:6)) at 100 μm spatial resolution (a) with measured H&E-stained microscopy image at 10 μm resolution (b), predicting the
ion distribution of m/z 762.5 at 10 μm resolution (reconstruction Score 82%) (c). For comparison,
(d) shows a measured ion image for 762.5 at 10 μm spatial resolution, acquired from a neighboring
tissue section. (Adapted with permission from Ref. [90]. Copyright 2015 Springer Nature)
7 Matrix-Assisted Laser Desorption/Ionization Imaging Mass Spectrometry…
an order of magnitude. Not only does this lead to “sharper” IMS images, but it also
allows prediction of ion distributions in areas not measured with IMS as well as
enrichment of biological signals and attenuation of instrumental artifacts. Some
dimensionality reduction methods discussed above, such as PCA, can help attenuate
such artifacts, but since those are only done with IMS images, they can only identify
IMS-related instrumental artifacts. By fusing multiple modalities, attenuation of
such artifacts can be improved. An example of this workflow can be seen in Fig. 7.9
below. Figure 7.9a below shows an ion image for m/z 762.5 with a spatial resolution
of 100 μm. Figure 7.9b shows a serial section of the same tissue stained using hematoxylin and eosin with a spatial resolution of 10 μm. Once the fusion method is
applied to these images, a predicted ion image of m/z 762.5 is generated at a 10 μm
spatial resolution (Fig. 7.9c) and is comparable to IMS of a serial section of the tissue obtained at 10 μm spatial resolution (Fig. 7.9d) [90].
7.14 Conclusion
Image registration and fusion are two methods that can be performed using IMS and
other imaging modalities that offer higher chemical and/or spatial resolution.
Ongoing efforts at the interface of hardware and software development seek to further improve chemical specificity, chemical coverage, and spatial resolution by
improving IMS technology as well as incorporating other imaging modalities such
as multiplexed immunofluorescence, transcriptomics, and elemental imaging.
Fig. 7.9 Prediction of the ion distribution of m/z 762.5 in mouse brain at 10 μm resolution from
100 μm IMS and 10 μm microscopy measurements (sharpening). This example in mouse brain
fuses a measured ion image for m/z 762.5 (identified as lipid PE(16:0/22:6)) at 100 μm spatial resolution (a) with measured H&E-stained microscopy image at 10 μm resolution (b), predicting the
ion distribution of m/z 762.5 at 10 μm resolution (reconstruction Score 82%) (c). For comparison,
(d) shows a measured ion image for 762.5 at 10 μm spatial resolution, acquired from a neighboring
tissue section. (Adapted with permission from Ref. [90]. Copyright 2015 Springer Nature)
7 Matrix-Assisted Laser Desorption/Ionization Imaging Mass Spectrometry…