

121
the resultant multimodal imaging data set. Here we discuss computational
approaches for data processing, which include pre-processing, visualization, statistical analysis, and multimodal data processing. A summary of a typical data analysis
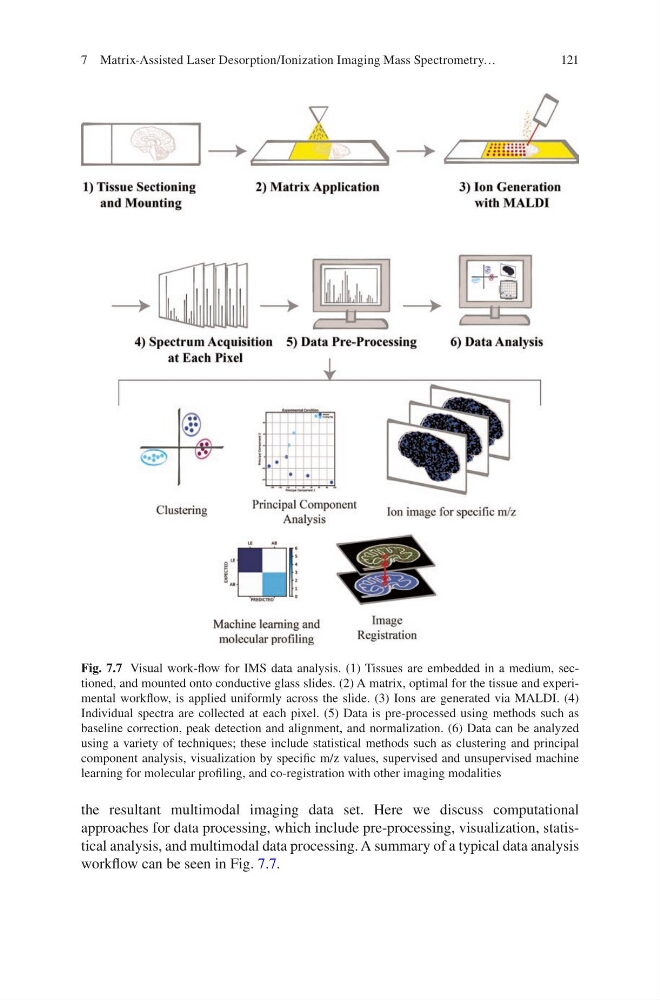
workflow can be seen in Fig. 7.7.
Fig. 7.7 Visual work-flow for IMS data analysis. (1) Tissues are embedded in a medium, sectioned, and mounted onto conductive glass slides. (2) A matrix, optimal for the tissue and experimental workflow, is applied uniformly across the slide. (3) Ions are generated via MALDI. (4)
Individual spectra are collected at each pixel. (5) Data is pre-processed using methods such as
baseline correction, peak detection and alignment, and normalization. (6) Data can be analyzed
using a variety of techniques; these include statistical methods such as clustering and principal
component analysis, visualization by specific m/z values, supervised and unsupervised machine
learning for molecular profiling, and co-registration with other imaging modalities
7 Matrix-Assisted Laser Desorption/Ionization Imaging Mass Spectrometry…
the resultant multimodal imaging data set. Here we discuss computational
approaches for data processing, which include pre-processing, visualization, statistical analysis, and multimodal data processing. A summary of a typical data analysis
workflow can be seen in Fig. 7.7.
Fig. 7.7 Visual work-flow for IMS data analysis. (1) Tissues are embedded in a medium, sectioned, and mounted onto conductive glass slides. (2) A matrix, optimal for the tissue and experimental workflow, is applied uniformly across the slide. (3) Ions are generated via MALDI. (4)
Individual spectra are collected at each pixel. (5) Data is pre-processed using methods such as
baseline correction, peak detection and alignment, and normalization. (6) Data can be analyzed
using a variety of techniques; these include statistical methods such as clustering and principal
component analysis, visualization by specific m/z values, supervised and unsupervised machine
learning for molecular profiling, and co-registration with other imaging modalities
7 Matrix-Assisted Laser Desorption/Ionization Imaging Mass Spectrometry…