

120
7.9 Data Analysis with IMS
IMS data is inherently complex and highly dimensional, requiring rigorous computational workflows to conduct effective analyses without losing valuable information. Data generated by IMS is also amenable to supplementation with other types
of imaging, which further requires computational workflows to register and process
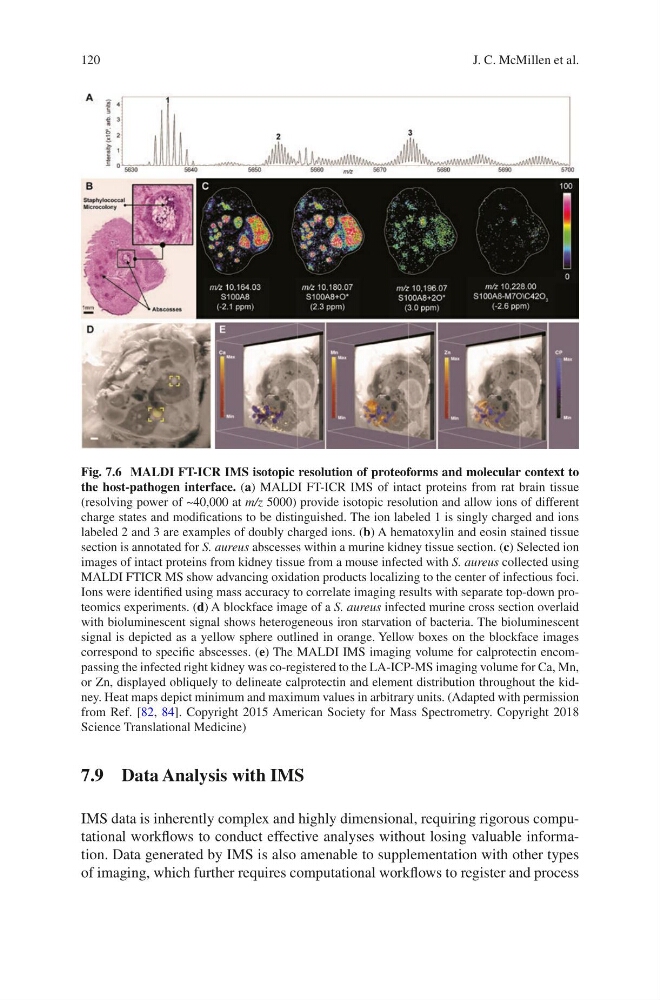
Fig. 7.6 MALDI FT-ICR IMS isotopic resolution of proteoforms and molecular context to
the host-pathogen interface. (a) MALDI FT-ICR IMS of intact proteins from rat brain tissue
(resolving power of ~40,000 at m/z 5000) provide isotopic resolution and allow ions of different
charge states and modifications to be distinguished. The ion labeled 1 is singly charged and ions
labeled 2 and 3 are examples of doubly charged ions. (b) A hematoxylin and eosin stained tissue
section is annotated for S. aureus abscesses within a murine kidney tissue section. (c) Selected ion
images of intact proteins from kidney tissue from a mouse infected with S. aureus collected using
MALDI FTICR MS show advancing oxidation products localizing to the center of infectious foci.
Ions were identified using mass accuracy to correlate imaging results with separate top-down proteomics experiments. (d) A blockface image of a S. aureus infected murine cross section overlaid
with bioluminescent signal shows heterogeneous iron starvation of bacteria. The bioluminescent
signal is depicted as a yellow sphere outlined in orange. Yellow boxes on the blockface images
correspond to specific abscesses. (e) The MALDI IMS imaging volume for calprotectin encompassing the infected right kidney was co-registered to the LA-ICP-MS imaging volume for Ca, Mn,
or Zn, displayed obliquely to delineate calprotectin and element distribution throughout the kidney. Heat maps depict minimum and maximum values in arbitrary units. (Adapted with permission
from Ref. [82, 84]. Copyright 2015 American Society for Mass Spectrometry. Copyright 2018
Science Translational Medicine)
J. C. McMillen et al.
7.9 Data Analysis with IMS
IMS data is inherently complex and highly dimensional, requiring rigorous computational workflows to conduct effective analyses without losing valuable information. Data generated by IMS is also amenable to supplementation with other types
of imaging, which further requires computational workflows to register and process
Fig. 7.6 MALDI FT-ICR IMS isotopic resolution of proteoforms and molecular context to
the host-pathogen interface. (a) MALDI FT-ICR IMS of intact proteins from rat brain tissue
(resolving power of ~40,000 at m/z 5000) provide isotopic resolution and allow ions of different
charge states and modifications to be distinguished. The ion labeled 1 is singly charged and ions
labeled 2 and 3 are examples of doubly charged ions. (b) A hematoxylin and eosin stained tissue
section is annotated for S. aureus abscesses within a murine kidney tissue section. (c) Selected ion
images of intact proteins from kidney tissue from a mouse infected with S. aureus collected using
MALDI FTICR MS show advancing oxidation products localizing to the center of infectious foci.
Ions were identified using mass accuracy to correlate imaging results with separate top-down proteomics experiments. (d) A blockface image of a S. aureus infected murine cross section overlaid
with bioluminescent signal shows heterogeneous iron starvation of bacteria. The bioluminescent
signal is depicted as a yellow sphere outlined in orange. Yellow boxes on the blockface images
correspond to specific abscesses. (e) The MALDI IMS imaging volume for calprotectin encompassing the infected right kidney was co-registered to the LA-ICP-MS imaging volume for Ca, Mn,
or Zn, displayed obliquely to delineate calprotectin and element distribution throughout the kidney. Heat maps depict minimum and maximum values in arbitrary units. (Adapted with permission
from Ref. [82, 84]. Copyright 2015 American Society for Mass Spectrometry. Copyright 2018
Science Translational Medicine)
J. C. McMillen et al.