

90
matrix and any sample handling/clean-up steps undertaken prior to analysis.
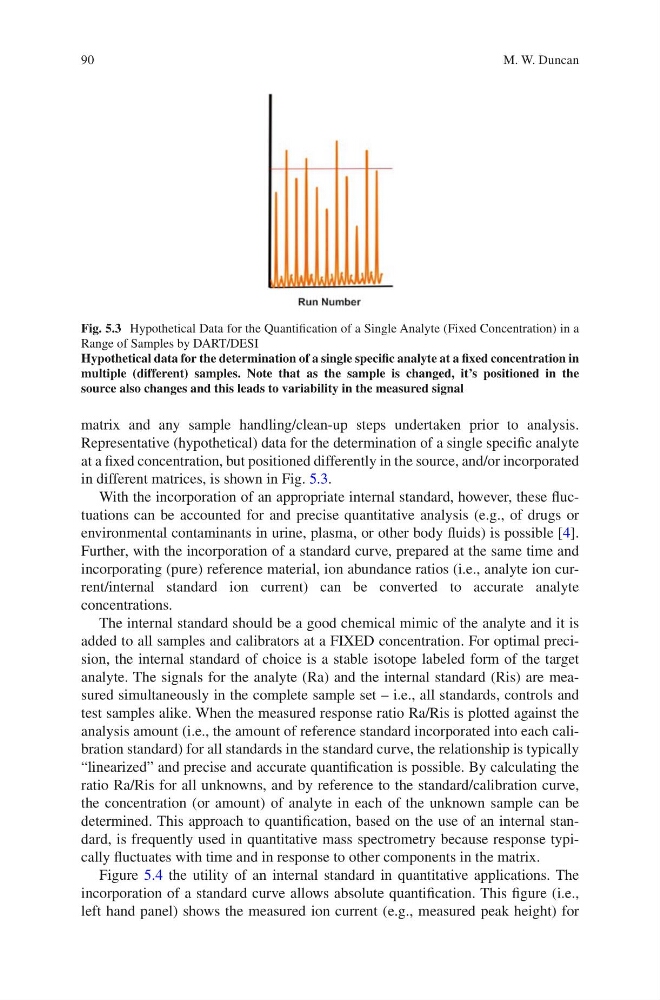
Representative (hypothetical) data for the determination of a single specific analyte
at a fixed concentration, but positioned differently in the source, and/or incorporated
in different matrices, is shown in Fig. 5.3.
With the incorporation of an appropriate internal standard, however, these fluctuations can be accounted for and precise quantitative analysis (e.g., of drugs or
environmental contaminants in urine, plasma, or other body fluids) is possible [4].
Further, with the incorporation of a standard curve, prepared at the same time and
incorporating (pure) reference material, ion abundance ratios (i.e., analyte ion current/internal standard ion current) can be converted to accurate analyte
concentrations.
The internal standard should be a good chemical mimic of the analyte and it is
added to all samples and calibrators at a FIXED concentration. For optimal precision, the internal standard of choice is a stable isotope labeled form of the target
analyte. The signals for the analyte (Ra) and the internal standard (Ris) are measured simultaneously in the complete sample set – i.e., all standards, controls and
test samples alike. When the measured response ratio Ra/Ris is plotted against the
analysis amount (i.e., the amount of reference standard incorporated into each calibration standard) for all standards in the standard curve, the relationship is typically
“linearized” and precise and accurate quantification is possible. By calculating the
ratio Ra/Ris for all unknowns, and by reference to the standard/calibration curve,
the concentration (or amount) of analyte in each of the unknown sample can be
determined. This approach to quantification, based on the use of an internal standard, is frequently used in quantitative mass spectrometry because response typically fluctuates with time and in response to other components in the matrix.
Figure 5.4 the utility of an internal standard in quantitative applications. The
incorporation of a standard curve allows absolute quantification. This figure (i.e.,
left hand panel) shows the measured ion current (e.g., measured peak height) for
Fig. 5.3 Hypothetical Data for the Quantification of a Single Analyte (Fixed Concentration) in a
Range of Samples by DART/DESI
Hypothetical data for the determination of a single specific analyte at a fixed concentration in
multiple (different) samples. Note that as the sample is changed, it’s positioned in the
source also changes and this leads to variability in the measured signal
M. W. Duncan
matrix and any sample handling/clean-up steps undertaken prior to analysis.
Representative (hypothetical) data for the determination of a single specific analyte
at a fixed concentration, but positioned differently in the source, and/or incorporated
in different matrices, is shown in Fig. 5.3.
With the incorporation of an appropriate internal standard, however, these fluctuations can be accounted for and precise quantitative analysis (e.g., of drugs or
environmental contaminants in urine, plasma, or other body fluids) is possible [4].
Further, with the incorporation of a standard curve, prepared at the same time and
incorporating (pure) reference material, ion abundance ratios (i.e., analyte ion current/internal standard ion current) can be converted to accurate analyte
concentrations.
The internal standard should be a good chemical mimic of the analyte and it is
added to all samples and calibrators at a FIXED concentration. For optimal precision, the internal standard of choice is a stable isotope labeled form of the target
analyte. The signals for the analyte (Ra) and the internal standard (Ris) are measured simultaneously in the complete sample set – i.e., all standards, controls and
test samples alike. When the measured response ratio Ra/Ris is plotted against the
analysis amount (i.e., the amount of reference standard incorporated into each calibration standard) for all standards in the standard curve, the relationship is typically
“linearized” and precise and accurate quantification is possible. By calculating the
ratio Ra/Ris for all unknowns, and by reference to the standard/calibration curve,
the concentration (or amount) of analyte in each of the unknown sample can be
determined. This approach to quantification, based on the use of an internal standard, is frequently used in quantitative mass spectrometry because response typically fluctuates with time and in response to other components in the matrix.
Figure 5.4 the utility of an internal standard in quantitative applications. The
incorporation of a standard curve allows absolute quantification. This figure (i.e.,
left hand panel) shows the measured ion current (e.g., measured peak height) for
Fig. 5.3 Hypothetical Data for the Quantification of a Single Analyte (Fixed Concentration) in a
Range of Samples by DART/DESI
Hypothetical data for the determination of a single specific analyte at a fixed concentration in
multiple (different) samples. Note that as the sample is changed, it’s positioned in the
source also changes and this leads to variability in the measured signal
M. W. Duncan