

37
adsorption that leads to the formation of H 2 gas proceeds on different metallic sites
than that of H UPD . The adsorption of hydrogen was first observed by cyclic voltammetry on a Pt electrode. Figure 5.1 shows a typical cyclic voltammetry profile of
Pt(poly) in aqueous medium, where the process of hydrogen adsorption and desorption is observed in the potential region of 0.05–0.4 V, just positive to the onset of
hydrogen evolution. The process occurring in the potential region positive to 0.6 V
is described as Pt-OH formation, which eventually leads to PtO. The adsorption of
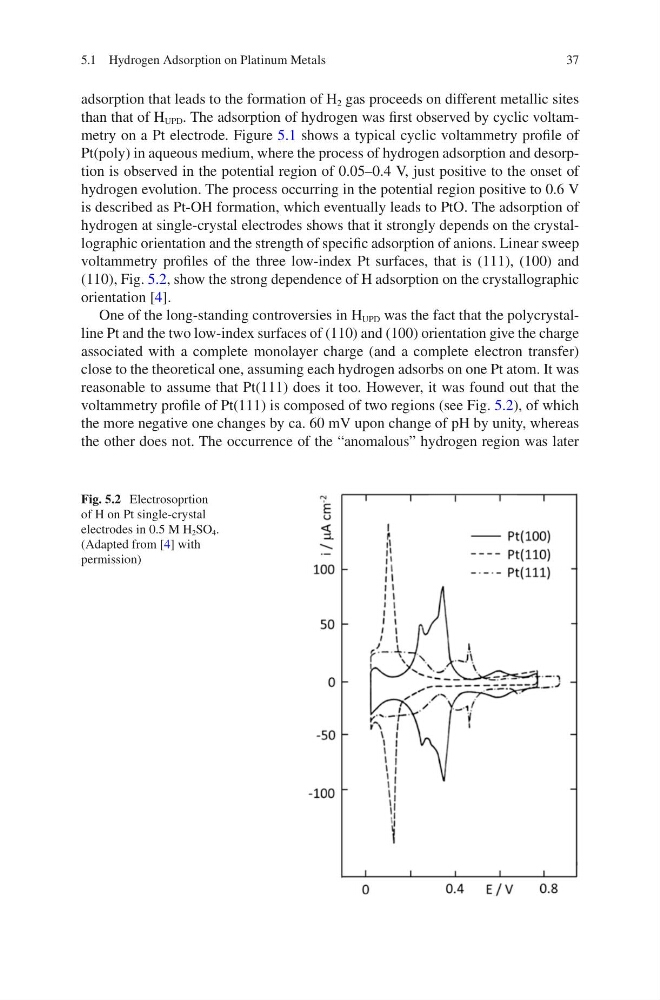
hydrogen at single-crystal electrodes shows that it strongly depends on the crystallographic orientation and the strength of specific adsorption of anions. Linear sweep
voltammetry profiles of the three low-index Pt surfaces, that is (111), (100) and
(110), Fig. 5.2, show the strong dependence of H adsorption on the crystallographic
orientation [4].
One of the long-standing controversies in H UPD was the fact that the polycrystalline Pt and the two low-index surfaces of (110) and (100) orientation give the charge
associated with a complete monolayer charge (and a complete electron transfer)
close to the theoretical one, assuming each hydrogen adsorbs on one Pt atom. It was
reasonable to assume that Pt(111) does it too. However, it was found out that the
voltammetry profile of Pt(111) is composed of two regions (see Fig. 5.2), of which
the more negative one changes by ca. 60 mV upon change of pH by unity, whereas
the other does not. The occurrence of the “anomalous” hydrogen region was later
Fig. 5.2 Electrosoprtion
of H on Pt single-crystal
electrodes in 0.5 M H 2 SO 4 .
(Adapted from [4] with
permission)
5.1 Hydrogen Adsorption on Platinum Metals
adsorption that leads to the formation of H 2 gas proceeds on different metallic sites
than that of H UPD . The adsorption of hydrogen was first observed by cyclic voltammetry on a Pt electrode. Figure 5.1 shows a typical cyclic voltammetry profile of
Pt(poly) in aqueous medium, where the process of hydrogen adsorption and desorption is observed in the potential region of 0.05–0.4 V, just positive to the onset of
hydrogen evolution. The process occurring in the potential region positive to 0.6 V
is described as Pt-OH formation, which eventually leads to PtO. The adsorption of
hydrogen at single-crystal electrodes shows that it strongly depends on the crystallographic orientation and the strength of specific adsorption of anions. Linear sweep
voltammetry profiles of the three low-index Pt surfaces, that is (111), (100) and
(110), Fig. 5.2, show the strong dependence of H adsorption on the crystallographic
orientation [4].
One of the long-standing controversies in H UPD was the fact that the polycrystalline Pt and the two low-index surfaces of (110) and (100) orientation give the charge
associated with a complete monolayer charge (and a complete electron transfer)
close to the theoretical one, assuming each hydrogen adsorbs on one Pt atom. It was
reasonable to assume that Pt(111) does it too. However, it was found out that the
voltammetry profile of Pt(111) is composed of two regions (see Fig. 5.2), of which
the more negative one changes by ca. 60 mV upon change of pH by unity, whereas
the other does not. The occurrence of the “anomalous” hydrogen region was later
Fig. 5.2 Electrosoprtion
of H on Pt single-crystal
electrodes in 0.5 M H 2 SO 4 .
(Adapted from [4] with
permission)
5.1 Hydrogen Adsorption on Platinum Metals