

149
solution. After immersing the electrode in the bromide-containing solution, Br
-
immediately is adsorbed on the surface, preferentially on the low-coordination sites,
since the atoms on those sites bind with Br more strongly than those on terrace sites.
In the cathodic scan, the reductive desorption of the bromine triggers the migration
of low-coordinated Pd to terrace sites to minimize the total surface free energy.
During the cycling, the adsorbed bromide layer undergoes rearrangement to attain
the stable adlayer structure on a given surface, e.g., (√3 ×√3)R30°-Br on Pd(111),
(2×2)-Br on Pd(100) [36]. Therefore, during this Br-rearrangement on the surface,
the adsorbed-Br may draw the dangling atoms to fill the defect sites to form a large
terrace patches containing an ordered Br-adlayer if the original terrace size is large
enough to stabilize it.
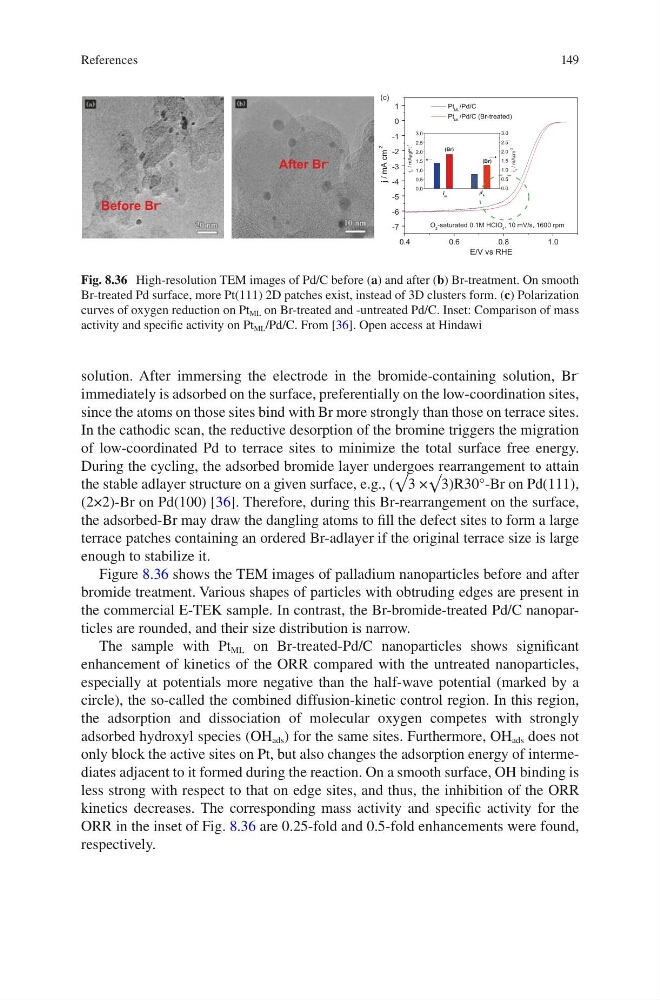
Figure 8.36 shows the TEM images of palladium nanoparticles before and after
bromide treatment. Various shapes of particles with obtruding edges are present in
the commercial E-TEK sample. In contrast, the Br-bromide-treated Pd/C nanoparticles are rounded, and their size distribution is narrow.
The sample with Pt ML on Br-treated-Pd/C nanoparticles shows significant
enhancement of kinetics of the ORR compared with the untreated nanoparticles,
especially at potentials more negative than the half-wave potential (marked by a
circle), the so-called the combined diffusion-kinetic control region. In this region,
the adsorption and dissociation of molecular oxygen competes with strongly
adsorbed hydroxyl species (OH ads ) for the same sites. Furthermore, OH ads does not
only block the active sites on Pt, but also changes the adsorption energy of intermediates adjacent to it formed during the reaction. On a smooth surface, OH binding is
less strong with respect to that on edge sites, and thus, the inhibition of the ORR
kinetics decreases. The corresponding mass activity and specific activity for the
ORR in the inset of Fig. 8.36 are 0.25-fold and 0.5-fold enhancements were found,
respectively.
Before Br -
After Br -
0.4
0 .6
0.8
1 .0
-7
-6
-5
-4
-3
-2
-1
0
1
0.0
0.5
1.0
1.5
2.0
2.5
3.0
0.0
0.5
1.0
1.5
2.0
2.5
3.0
(Br)
i s
i
s / mAcm -2
i
m / mAmgPt -1
i m
(Br)
(c)
m
c
A
m
/
j
-2
E/V vs RHE
Pt ML /Pd/C
Pt ML /Pd/C (Br-treated)
O 2 -saturated 0.1M HClO 4 , 10 mV/s, 1600 rpm
Fig. 8.36 High-resolution TEM images of Pd/C before (a) and after (b) Br-treatment. On smooth
Br-treated Pd surface, more Pt(111) 2D patches exist, instead of 3D clusters form. (c) Polarization
curves of oxygen reduction on Pt ML on Br-treated and -untreated Pd/C. Inset: Comparison of mass
activity and specific activity on Pt ML /Pd/C. From [36]. Open access at Hindawi
References
solution. After immersing the electrode in the bromide-containing solution, Br
-
immediately is adsorbed on the surface, preferentially on the low-coordination sites,
since the atoms on those sites bind with Br more strongly than those on terrace sites.
In the cathodic scan, the reductive desorption of the bromine triggers the migration
of low-coordinated Pd to terrace sites to minimize the total surface free energy.
During the cycling, the adsorbed bromide layer undergoes rearrangement to attain
the stable adlayer structure on a given surface, e.g., (√3 ×√3)R30°-Br on Pd(111),
(2×2)-Br on Pd(100) [36]. Therefore, during this Br-rearrangement on the surface,
the adsorbed-Br may draw the dangling atoms to fill the defect sites to form a large
terrace patches containing an ordered Br-adlayer if the original terrace size is large
enough to stabilize it.
Figure 8.36 shows the TEM images of palladium nanoparticles before and after
bromide treatment. Various shapes of particles with obtruding edges are present in
the commercial E-TEK sample. In contrast, the Br-bromide-treated Pd/C nanoparticles are rounded, and their size distribution is narrow.
The sample with Pt ML on Br-treated-Pd/C nanoparticles shows significant
enhancement of kinetics of the ORR compared with the untreated nanoparticles,
especially at potentials more negative than the half-wave potential (marked by a
circle), the so-called the combined diffusion-kinetic control region. In this region,
the adsorption and dissociation of molecular oxygen competes with strongly
adsorbed hydroxyl species (OH ads ) for the same sites. Furthermore, OH ads does not
only block the active sites on Pt, but also changes the adsorption energy of intermediates adjacent to it formed during the reaction. On a smooth surface, OH binding is
less strong with respect to that on edge sites, and thus, the inhibition of the ORR
kinetics decreases. The corresponding mass activity and specific activity for the
ORR in the inset of Fig. 8.36 are 0.25-fold and 0.5-fold enhancements were found,
respectively.
Before Br -
After Br -
0.4
0 .6
0.8
1 .0
-7
-6
-5
-4
-3
-2
-1
0
1
0.0
0.5
1.0
1.5
2.0
2.5
3.0
0.0
0.5
1.0
1.5
2.0
2.5
3.0
(Br)
i s
i
s / mAcm -2
i
m / mAmgPt -1
i m
(Br)
(c)
m
c
A
m
/
j
-2
E/V vs RHE
Pt ML /Pd/C
Pt ML /Pd/C (Br-treated)
O 2 -saturated 0.1M HClO 4 , 10 mV/s, 1600 rpm
Fig. 8.36 High-resolution TEM images of Pd/C before (a) and after (b) Br-treatment. On smooth
Br-treated Pd surface, more Pt(111) 2D patches exist, instead of 3D clusters form. (c) Polarization
curves of oxygen reduction on Pt ML on Br-treated and -untreated Pd/C. Inset: Comparison of mass
activity and specific activity on Pt ML /Pd/C. From [36]. Open access at Hindawi
References