

72
4 Mechanical characterization on constituent level
4.3.2 Numerical modelling and calibration
Since the adhesive forms a voluminous plastic component after bonding in the sandwich
panel, it is modeled using 3D-continuum elements (C3D8R), similar to the homogenized
core model in section 4.1.4. As in the previous face sheet simulation, the conducted tests
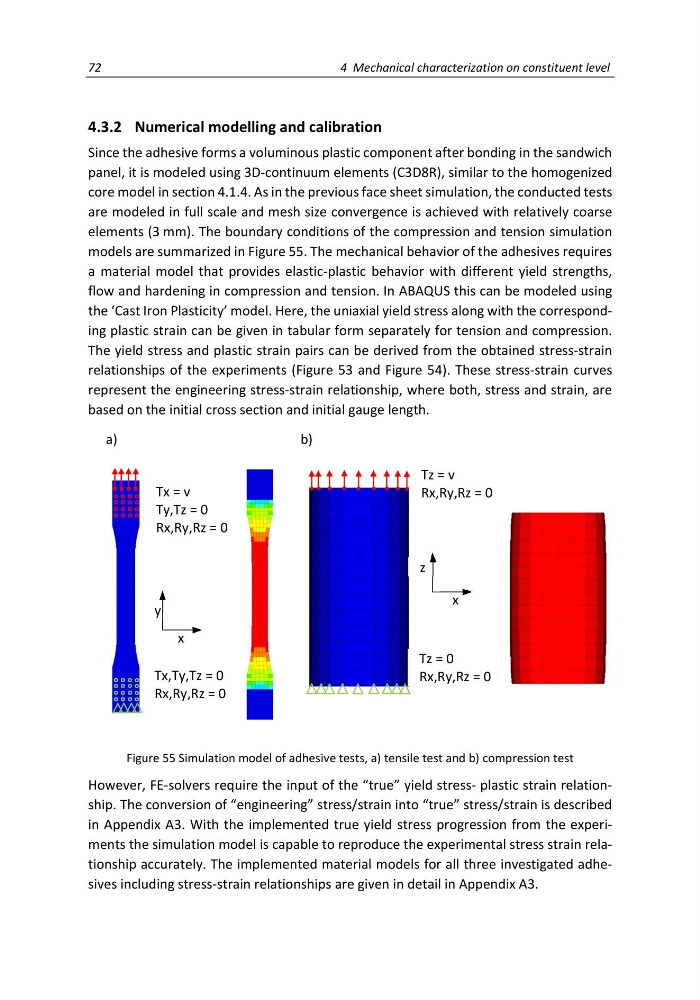
are modeled in full scale and mesh size convergence is achieved with relatively coarse
elements (3 mm). The boundary conditions of the compression and tension simulation
models are summarized in Figure 55. The mechanical behavior of the adhesives requires
a material model that provides elastic-plastic behavior with different yield strengths,
flow and hardening in compression and tension. In ABAQUS this can be modeled using
the ‘Cast Iron Plasticity’ model. Here, the uniaxial yield stress along with the corresponding plastic strain can be given in tabular form separately for tension and compression.
The yield stress and plastic strain pairs can be derived from the obtained stress-strain
relationships of the experiments (Figure 53 and Figure 54). These stress-strain curves
represent the engineering stress-strain relationship, where both, stress and strain, are
based on the initial cross section and initial gauge length.
a)
b)
Figure 55 Simulation model of adhesive tests, a) tensile test and b) compression test
However, FE-solvers require the input of the “true” yield stress- plastic strain relationship. The conversion of “engineering” stress/strain into “true” stress/strain is described
in Appendix A3. With the implemented true yield stress progression from the experiments the simulation model is capable to reproduce the experimental stress strain relationship accurately. The implemented material models for all three investigated adhesives including stress-strain relationships are given in detail in Appendix A3.
Tx = v
Ty,Tz = 0
Rx,Ry,Rz = 0
y
x
Tx,Ty,Tz = 0
Rx,Ry,Rz = 0
Tz = v
Rx,Ry,Rz = 0
z
x
Tz = 0
Rx,Ry,Rz = 0
4 Mechanical characterization on constituent level
4.3.2 Numerical modelling and calibration
Since the adhesive forms a voluminous plastic component after bonding in the sandwich
panel, it is modeled using 3D-continuum elements (C3D8R), similar to the homogenized
core model in section 4.1.4. As in the previous face sheet simulation, the conducted tests
are modeled in full scale and mesh size convergence is achieved with relatively coarse
elements (3 mm). The boundary conditions of the compression and tension simulation
models are summarized in Figure 55. The mechanical behavior of the adhesives requires
a material model that provides elastic-plastic behavior with different yield strengths,
flow and hardening in compression and tension. In ABAQUS this can be modeled using
the ‘Cast Iron Plasticity’ model. Here, the uniaxial yield stress along with the corresponding plastic strain can be given in tabular form separately for tension and compression.
The yield stress and plastic strain pairs can be derived from the obtained stress-strain
relationships of the experiments (Figure 53 and Figure 54). These stress-strain curves
represent the engineering stress-strain relationship, where both, stress and strain, are
based on the initial cross section and initial gauge length.
a)
b)
Figure 55 Simulation model of adhesive tests, a) tensile test and b) compression test
However, FE-solvers require the input of the “true” yield stress- plastic strain relationship. The conversion of “engineering” stress/strain into “true” stress/strain is described
in Appendix A3. With the implemented true yield stress progression from the experiments the simulation model is capable to reproduce the experimental stress strain relationship accurately. The implemented material models for all three investigated adhesives including stress-strain relationships are given in detail in Appendix A3.
Tx = v
Ty,Tz = 0
Rx,Ry,Rz = 0
y
x
Tx,Ty,Tz = 0
Rx,Ry,Rz = 0
Tz = v
Rx,Ry,Rz = 0
z
x
Tz = 0
Rx,Ry,Rz = 0