

4.2 Face sheets
67
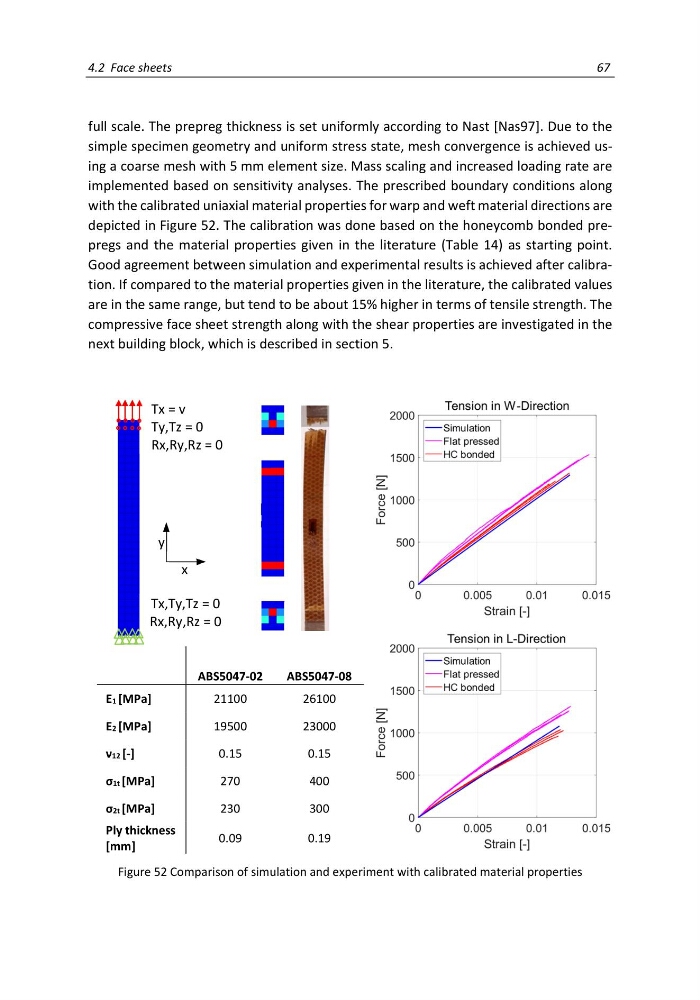
full scale. The prepreg thickness is set uniformly according to Nast [Nas97]. Due to the
simple specimen geometry and uniform stress state, mesh convergence is achieved using a coarse mesh with 5 mm element size. Mass scaling and increased loading rate are
implemented based on sensitivity analyses. The prescribed boundary conditions along
with the calibrated uniaxial material properties for warp and weft material directions are
depicted in Figure 52. The calibration was done based on the honeycomb bonded prepregs and the material properties given in the literature (Table 14) as starting point.
Good agreement between simulation and experimental results is achieved after calibration. If compared to the material properties given in the literature, the calibrated values
are in the same range, but tend to be about 15% higher in terms of tensile strength. The
compressive face sheet strength along with the shear properties are investigated in the
next building block, which is described in section 5.
ABS5047-02
ABS5047-08
E1 [MPa]
21100
26100
E2 [MPa]
19500
23000
ν12 [-]
0.15
0.15
σ1t [MPa]
270
400
σ2t [MPa]
230
300
Ply thickness
[mm]
0.09
0.19
Figure 52 Comparison of simulation and experiment with calibrated material properties
Tx = v
Ty,Tz = 0
Rx,Ry,Rz = 0
y
x
Tx,Ty,Tz = 0
Rx,Ry,Rz = 0
67
full scale. The prepreg thickness is set uniformly according to Nast [Nas97]. Due to the
simple specimen geometry and uniform stress state, mesh convergence is achieved using a coarse mesh with 5 mm element size. Mass scaling and increased loading rate are
implemented based on sensitivity analyses. The prescribed boundary conditions along
with the calibrated uniaxial material properties for warp and weft material directions are
depicted in Figure 52. The calibration was done based on the honeycomb bonded prepregs and the material properties given in the literature (Table 14) as starting point.
Good agreement between simulation and experimental results is achieved after calibration. If compared to the material properties given in the literature, the calibrated values
are in the same range, but tend to be about 15% higher in terms of tensile strength. The
compressive face sheet strength along with the shear properties are investigated in the
next building block, which is described in section 5.
ABS5047-02
ABS5047-08
E1 [MPa]
21100
26100
E2 [MPa]
19500
23000
ν12 [-]
0.15
0.15
σ1t [MPa]
270
400
σ2t [MPa]
230
300
Ply thickness
[mm]
0.09
0.19
Figure 52 Comparison of simulation and experiment with calibrated material properties
Tx = v
Ty,Tz = 0
Rx,Ry,Rz = 0
y
x
Tx,Ty,Tz = 0
Rx,Ry,Rz = 0