

4.2 Face sheets
65
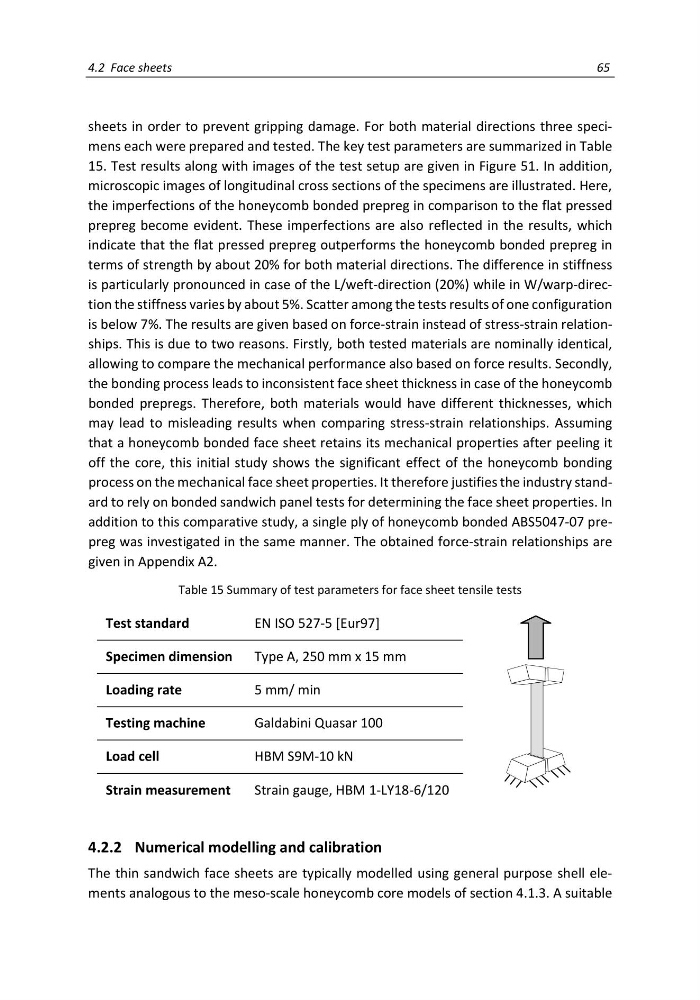
sheets in order to prevent gripping damage. For both material directions three specimens each were prepared and tested. The key test parameters are summarized in Table
15. Test results along with images of the test setup are given in Figure 51. In addition,
microscopic images of longitudinal cross sections of the specimens are illustrated. Here,
the imperfections of the honeycomb bonded prepreg in comparison to the flat pressed
prepreg become evident. These imperfections are also reflected in the results, which
indicate that the flat pressed prepreg outperforms the honeycomb bonded prepreg in
terms of strength by about 20% for both material directions. The difference in stiffness
is particularly pronounced in case of the L/weft-direction (20%) while in W/warp-direction the stiffness varies by about 5%. Scatter among the tests results of one configuration
is below 7%. The results are given based on force-strain instead of stress-strain relationships. This is due to two reasons. Firstly, both tested materials are nominally identical,
allowing to compare the mechanical performance also based on force results. Secondly,
the bonding process leads to inconsistent face sheet thickness in case of the honeycomb
bonded prepregs. Therefore, both materials would have different thicknesses, which
may lead to misleading results when comparing stress-strain relationships. Assuming
that a honeycomb bonded face sheet retains its mechanical properties after peeling it
off the core, this initial study shows the significant effect of the honeycomb bonding
process on the mechanical face sheet properties. It therefore justifies the industry standard to rely on bonded sandwich panel tests for determining the face sheet properties. In
addition to this comparative study, a single ply of honeycomb bonded ABS5047-07 prepreg was investigated in the same manner. The obtained force-strain relationships are
given in Appendix A2.
Table 15 Summary of test parameters for face sheet tensile tests
Test standard
EN ISO 527-5 [Eur97]
Specimen dimension Type A, 250 mm x 15 mm
Loading rate
5 mm/ min
Testing machine
Galdabini Quasar 100
Load cell
HBM S9M-10 kN
Strain measurement
Strain gauge, HBM 1-LY18-6/120
4.2.2 Numerical modelling and calibration
The thin sandwich face sheets are typically modelled using general purpose shell elements analogous to the meso-scale honeycomb core models of section 4.1.3. A suitable
65
sheets in order to prevent gripping damage. For both material directions three specimens each were prepared and tested. The key test parameters are summarized in Table
15. Test results along with images of the test setup are given in Figure 51. In addition,
microscopic images of longitudinal cross sections of the specimens are illustrated. Here,
the imperfections of the honeycomb bonded prepreg in comparison to the flat pressed
prepreg become evident. These imperfections are also reflected in the results, which
indicate that the flat pressed prepreg outperforms the honeycomb bonded prepreg in
terms of strength by about 20% for both material directions. The difference in stiffness
is particularly pronounced in case of the L/weft-direction (20%) while in W/warp-direction the stiffness varies by about 5%. Scatter among the tests results of one configuration
is below 7%. The results are given based on force-strain instead of stress-strain relationships. This is due to two reasons. Firstly, both tested materials are nominally identical,
allowing to compare the mechanical performance also based on force results. Secondly,
the bonding process leads to inconsistent face sheet thickness in case of the honeycomb
bonded prepregs. Therefore, both materials would have different thicknesses, which
may lead to misleading results when comparing stress-strain relationships. Assuming
that a honeycomb bonded face sheet retains its mechanical properties after peeling it
off the core, this initial study shows the significant effect of the honeycomb bonding
process on the mechanical face sheet properties. It therefore justifies the industry standard to rely on bonded sandwich panel tests for determining the face sheet properties. In
addition to this comparative study, a single ply of honeycomb bonded ABS5047-07 prepreg was investigated in the same manner. The obtained force-strain relationships are
given in Appendix A2.
Table 15 Summary of test parameters for face sheet tensile tests
Test standard
EN ISO 527-5 [Eur97]
Specimen dimension Type A, 250 mm x 15 mm
Loading rate
5 mm/ min
Testing machine
Galdabini Quasar 100
Load cell
HBM S9M-10 kN
Strain measurement
Strain gauge, HBM 1-LY18-6/120
4.2.2 Numerical modelling and calibration
The thin sandwich face sheets are typically modelled using general purpose shell elements analogous to the meso-scale honeycomb core models of section 4.1.3. A suitable