

7.4 Phase 3 - Model development
133
0
1
2
3
4
5
Displacement [mm]
0
500
1000
1500
2000
Force [N]
PullOut | FP-10-101
Test scatter
Test average
Simulation
0
1
2
3
4
5
Displacement [mm]
0
500
1000
1500
2000
Force [N]
PullOut | FP-19-101
0
1
2
3
4
5
Displacement [mm]
0
500
1000
1500
2000
Force [N]
PullOut | FP-26-101
3
2
4
1
5
Stiffness deviation in
stage 3
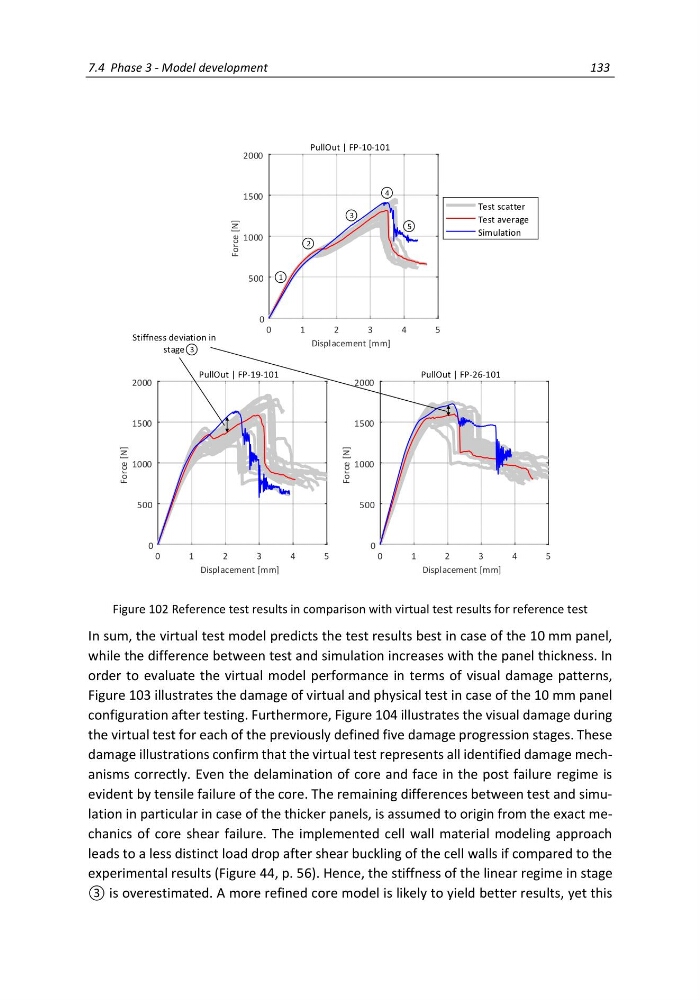
Figure 102 Reference test results in comparison with virtual test results for reference test
In sum, the virtual test model predicts the test results best in case of the 10 mm panel,
while the difference between test and simulation increases with the panel thickness. In
order to evaluate the virtual model performance in terms of visual damage patterns,
Figure 103 illustrates the damage of virtual and physical test in case of the 10 mm panel
configuration after testing. Furthermore, Figure 104 illustrates the visual damage during
the virtual test for each of the previously defined five damage progression stages. These
damage illustrations confirm that the virtual test represents all identified damage mechanisms correctly. Even the delamination of core and face in the post failure regime is
evident by tensile failure of the core. The remaining differences between test and simulation in particular in case of the thicker panels, is assumed to origin from the exact mechanics of core shear failure. The implemented cell wall material modeling approach
leads to a less distinct load drop after shear buckling of the cell walls if compared to the
experimental results (Figure 44, p. 56). Hence, the stiffness of the linear regime in stage
③ is overestimated. A more refined core model is likely to yield better results, yet this
133
0
1
2
3
4
5
Displacement [mm]
0
500
1000
1500
2000
Force [N]
PullOut | FP-10-101
Test scatter
Test average
Simulation
0
1
2
3
4
5
Displacement [mm]
0
500
1000
1500
2000
Force [N]
PullOut | FP-19-101
0
1
2
3
4
5
Displacement [mm]
0
500
1000
1500
2000
Force [N]
PullOut | FP-26-101
3
2
4
1
5
Stiffness deviation in
stage 3
Figure 102 Reference test results in comparison with virtual test results for reference test
In sum, the virtual test model predicts the test results best in case of the 10 mm panel,
while the difference between test and simulation increases with the panel thickness. In
order to evaluate the virtual model performance in terms of visual damage patterns,
Figure 103 illustrates the damage of virtual and physical test in case of the 10 mm panel
configuration after testing. Furthermore, Figure 104 illustrates the visual damage during
the virtual test for each of the previously defined five damage progression stages. These
damage illustrations confirm that the virtual test represents all identified damage mechanisms correctly. Even the delamination of core and face in the post failure regime is
evident by tensile failure of the core. The remaining differences between test and simulation in particular in case of the thicker panels, is assumed to origin from the exact mechanics of core shear failure. The implemented cell wall material modeling approach
leads to a less distinct load drop after shear buckling of the cell walls if compared to the
experimental results (Figure 44, p. 56). Hence, the stiffness of the linear regime in stage
③ is overestimated. A more refined core model is likely to yield better results, yet this