

122
7 Virtual testing approach for sandwich panel joints
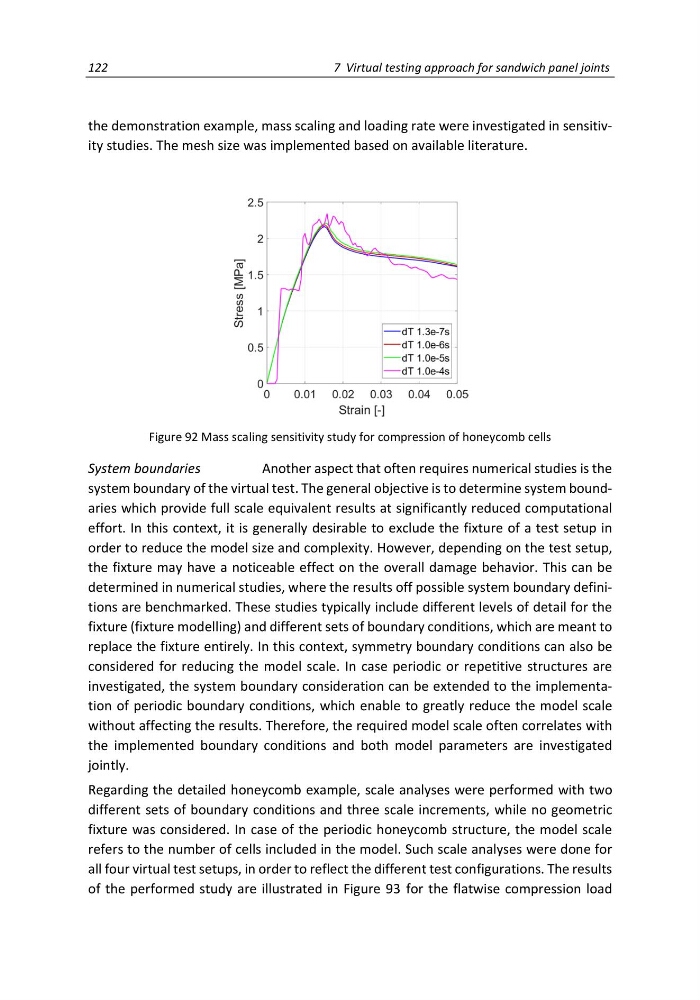
the demonstration example, mass scaling and loading rate were investigated in sensitivity studies. The mesh size was implemented based on available literature.
Figure 92 Mass scaling sensitivity study for compression of honeycomb cells
System boundaries
Another aspect that often requires numerical studies is the
system boundary of the virtual test. The general objective is to determine system boundaries which provide full scale equivalent results at significantly reduced computational
effort. In this context, it is generally desirable to exclude the fixture of a test setup in
order to reduce the model size and complexity. However, depending on the test setup,
the fixture may have a noticeable effect on the overall damage behavior. This can be
determined in numerical studies, where the results off possible system boundary definitions are benchmarked. These studies typically include different levels of detail for the
fixture (fixture modelling) and different sets of boundary conditions, which are meant to
replace the fixture entirely. In this context, symmetry boundary conditions can also be
considered for reducing the model scale. In case periodic or repetitive structures are
investigated, the system boundary consideration can be extended to the implementation of periodic boundary conditions, which enable to greatly reduce the model scale
without affecting the results. Therefore, the required model scale often correlates with
the implemented boundary conditions and both model parameters are investigated
jointly.
Regarding the detailed honeycomb example, scale analyses were performed with two
different sets of boundary conditions and three scale increments, while no geometric
fixture was considered. In case of the periodic honeycomb structure, the model scale
refers to the number of cells included in the model. Such scale analyses were done for
all four virtual test setups, in order to reflect the different test configurations. The results
of the performed study are illustrated in Figure 93 for the flatwise compression load
7 Virtual testing approach for sandwich panel joints
the demonstration example, mass scaling and loading rate were investigated in sensitivity studies. The mesh size was implemented based on available literature.
Figure 92 Mass scaling sensitivity study for compression of honeycomb cells
System boundaries
Another aspect that often requires numerical studies is the
system boundary of the virtual test. The general objective is to determine system boundaries which provide full scale equivalent results at significantly reduced computational
effort. In this context, it is generally desirable to exclude the fixture of a test setup in
order to reduce the model size and complexity. However, depending on the test setup,
the fixture may have a noticeable effect on the overall damage behavior. This can be
determined in numerical studies, where the results off possible system boundary definitions are benchmarked. These studies typically include different levels of detail for the
fixture (fixture modelling) and different sets of boundary conditions, which are meant to
replace the fixture entirely. In this context, symmetry boundary conditions can also be
considered for reducing the model scale. In case periodic or repetitive structures are
investigated, the system boundary consideration can be extended to the implementation of periodic boundary conditions, which enable to greatly reduce the model scale
without affecting the results. Therefore, the required model scale often correlates with
the implemented boundary conditions and both model parameters are investigated
jointly.
Regarding the detailed honeycomb example, scale analyses were performed with two
different sets of boundary conditions and three scale increments, while no geometric
fixture was considered. In case of the periodic honeycomb structure, the model scale
refers to the number of cells included in the model. Such scale analyses were done for
all four virtual test setups, in order to reflect the different test configurations. The results
of the performed study are illustrated in Figure 93 for the flatwise compression load