

454
8 Morphogenesis
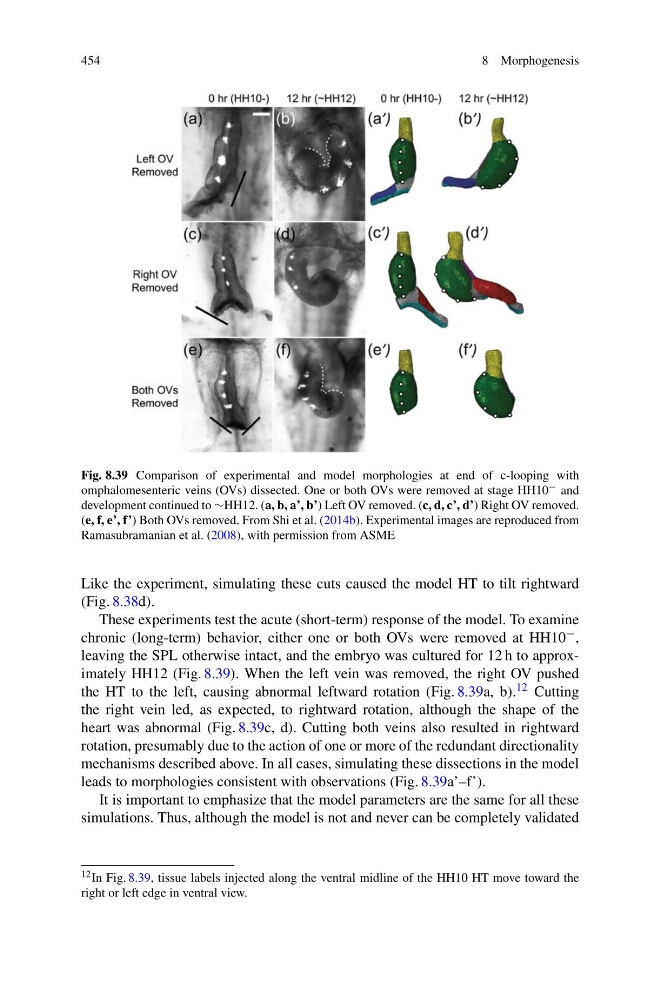
Fig. 8.39 Comparison of experimental and model morphologies at end of c-looping with
omphalomesenteric veins (OVs) dissected. One or both OVs were removed at stage HH10 − and
development continued to ∼HH12. (a, b, a’, b’) Left OV removed. (c, d, c’, d’) Right OV removed.
(e, f, e’, f’) Both OVs removed. From Shi et al. (2014b). Experimental images are reproduced from
Ramasubramanian et al. (2008), with permission from ASME
Like the experiment, simulating these cuts caused the model HT to tilt rightward
(Fig. 8.38d).
These experiments test the acute (short-term) response of the model. To examine
chronic (long-term) behavior, either one or both OVs were removed at HH10 − ,
leaving the SPL otherwise intact, and the embryo was cultured for 12 h to approximately HH12 (Fig. 8.39). When the left vein was removed, the right OV pushed
the HT to the left, causing abnormal leftward rotation (Fig. 8.39a, b). 12 Cutting
the right vein led, as expected, to rightward rotation, although the shape of the
heart was abnormal (Fig. 8.39c, d). Cutting both veins also resulted in rightward
rotation, presumably due to the action of one or more of the redundant directionality
mechanisms described above. In all cases, simulating these dissections in the model
leads to morphologies consistent with observations (Fig. 8.39a’–f’).
It is important to emphasize that the model parameters are the same for all these
simulations. Thus, although the model is not and never can be completely validated
12 In Fig. 8.39, tissue labels injected along the ventral midline of the HH10 HT move toward the
right or left edge in ventral view.
8 Morphogenesis
Fig. 8.39 Comparison of experimental and model morphologies at end of c-looping with
omphalomesenteric veins (OVs) dissected. One or both OVs were removed at stage HH10 − and
development continued to ∼HH12. (a, b, a’, b’) Left OV removed. (c, d, c’, d’) Right OV removed.
(e, f, e’, f’) Both OVs removed. From Shi et al. (2014b). Experimental images are reproduced from
Ramasubramanian et al. (2008), with permission from ASME
Like the experiment, simulating these cuts caused the model HT to tilt rightward
(Fig. 8.38d).
These experiments test the acute (short-term) response of the model. To examine
chronic (long-term) behavior, either one or both OVs were removed at HH10 − ,
leaving the SPL otherwise intact, and the embryo was cultured for 12 h to approximately HH12 (Fig. 8.39). When the left vein was removed, the right OV pushed
the HT to the left, causing abnormal leftward rotation (Fig. 8.39a, b). 12 Cutting
the right vein led, as expected, to rightward rotation, although the shape of the
heart was abnormal (Fig. 8.39c, d). Cutting both veins also resulted in rightward
rotation, presumably due to the action of one or more of the redundant directionality
mechanisms described above. In all cases, simulating these dissections in the model
leads to morphologies consistent with observations (Fig. 8.39a’–f’).
It is important to emphasize that the model parameters are the same for all these
simulations. Thus, although the model is not and never can be completely validated
12 In Fig. 8.39, tissue labels injected along the ventral midline of the HH10 HT move toward the
right or left edge in ventral view.