

450
8 Morphogenesis
J G = G r G θ G z = G I C + (G OC − G I C )((/π ),
where G I C = 1 and G OC = 3 at the inner and outer curvature, respectively, and
= 0 at the inner curvature. With J G known, Shi et al. (2014a) assumed G r =
G θ =
√
J G /G z and determined G z by matching computed and experimentally
measured surface strains. Specifying this growth pattern in the myocardium
causes considerable bending (Fig. 8.35b).
3. Active cell-shape change: During c-looping, myocardial cells near the inner
curvature shorten in the longitudinal direction and extend circumferentially
(Manasek et al. 1972). These isovolumic changes in cell shape are included by
specifying circumferential growth in the myocardium (G θ = G −1
z ; G r = 1).
This causes additional bending (Fig. 8.35c).
The final shape of the model is consistent with HTs cultured for 24 h from stage
HH10, with the dorsal side becoming the inner curvature (Fig. 8.34).
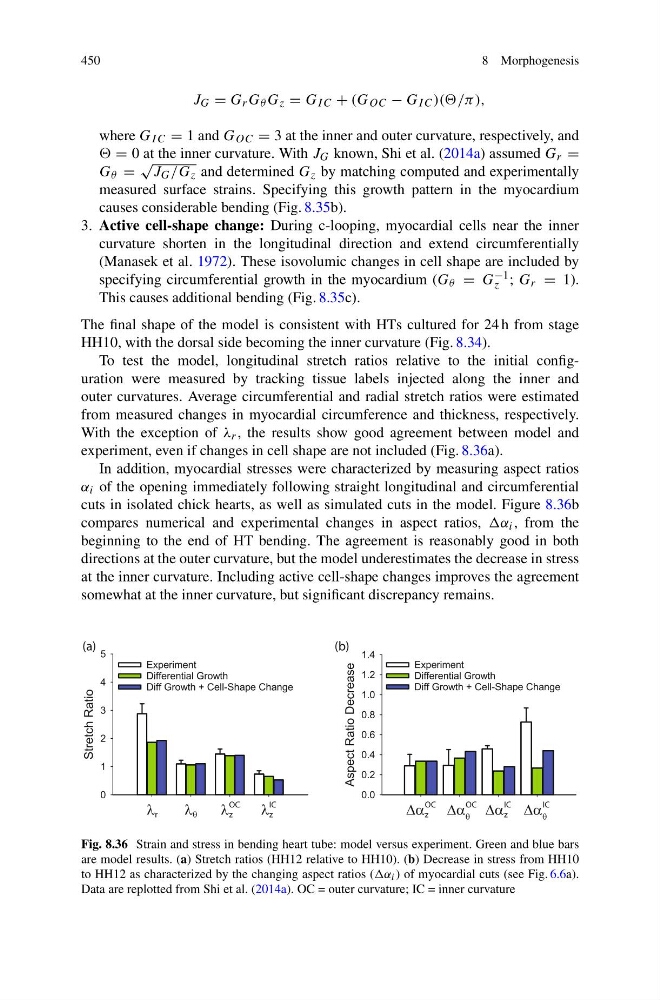
To test the model, longitudinal stretch ratios relative to the initial configuration were measured by tracking tissue labels injected along the inner and
outer curvatures. Average circumferential and radial stretch ratios were estimated
from measured changes in myocardial circumference and thickness, respectively.
With the exception of λ r , the results show good agreement between model and
experiment, even if changes in cell shape are not included (Fig. 8.36a).
In addition, myocardial stresses were characterized by measuring aspect ratios
α i of the opening immediately following straight longitudinal and circumferential
cuts in isolated chick hearts, as well as simulated cuts in the model. Figure 8.36b
compares numerical and experimental changes in aspect ratios, α i , from the
beginning to the end of HT bending. The agreement is reasonably good in both
directions at the outer curvature, but the model underestimates the decrease in stress
at the inner curvature. Including active cell-shape changes improves the agreement
somewhat at the inner curvature, but significant discrepancy remains.
λ r
λ θ
λ z
OC
λ z
IC
Δα z
OC Δα θ
OC Δα z
IC Δα θ
IC
(a)
(b)
Fig. 8.36 Strain and stress in bending heart tube: model versus experiment. Green and blue bars
are model results. (a) Stretch ratios (HH12 relative to HH10). (b) Decrease in stress from HH10
to HH12 as characterized by the changing aspect ratios (α i ) of myocardial cuts (see Fig. 6.6a).
Data are replotted from Shi et al. (2014a). OC = outer curvature; IC = inner curvature
8 Morphogenesis
J G = G r G θ G z = G I C + (G OC − G I C )((/π ),
where G I C = 1 and G OC = 3 at the inner and outer curvature, respectively, and
= 0 at the inner curvature. With J G known, Shi et al. (2014a) assumed G r =
G θ =
√
J G /G z and determined G z by matching computed and experimentally
measured surface strains. Specifying this growth pattern in the myocardium
causes considerable bending (Fig. 8.35b).
3. Active cell-shape change: During c-looping, myocardial cells near the inner
curvature shorten in the longitudinal direction and extend circumferentially
(Manasek et al. 1972). These isovolumic changes in cell shape are included by
specifying circumferential growth in the myocardium (G θ = G −1
z ; G r = 1).
This causes additional bending (Fig. 8.35c).
The final shape of the model is consistent with HTs cultured for 24 h from stage
HH10, with the dorsal side becoming the inner curvature (Fig. 8.34).
To test the model, longitudinal stretch ratios relative to the initial configuration were measured by tracking tissue labels injected along the inner and
outer curvatures. Average circumferential and radial stretch ratios were estimated
from measured changes in myocardial circumference and thickness, respectively.
With the exception of λ r , the results show good agreement between model and
experiment, even if changes in cell shape are not included (Fig. 8.36a).
In addition, myocardial stresses were characterized by measuring aspect ratios
α i of the opening immediately following straight longitudinal and circumferential
cuts in isolated chick hearts, as well as simulated cuts in the model. Figure 8.36b
compares numerical and experimental changes in aspect ratios, α i , from the
beginning to the end of HT bending. The agreement is reasonably good in both
directions at the outer curvature, but the model underestimates the decrease in stress
at the inner curvature. Including active cell-shape changes improves the agreement
somewhat at the inner curvature, but significant discrepancy remains.
λ r
λ θ
λ z
OC
λ z
IC
Δα z
OC Δα θ
OC Δα z
IC Δα θ
IC
(a)
(b)
Fig. 8.36 Strain and stress in bending heart tube: model versus experiment. Green and blue bars
are model results. (a) Stretch ratios (HH12 relative to HH10). (b) Decrease in stress from HH10
to HH12 as characterized by the changing aspect ratios (α i ) of myocardial cuts (see Fig. 6.6a).
Data are replotted from Shi et al. (2014a). OC = outer curvature; IC = inner curvature