

17 Exploitation of Rivers in Poland for Electricity …
345
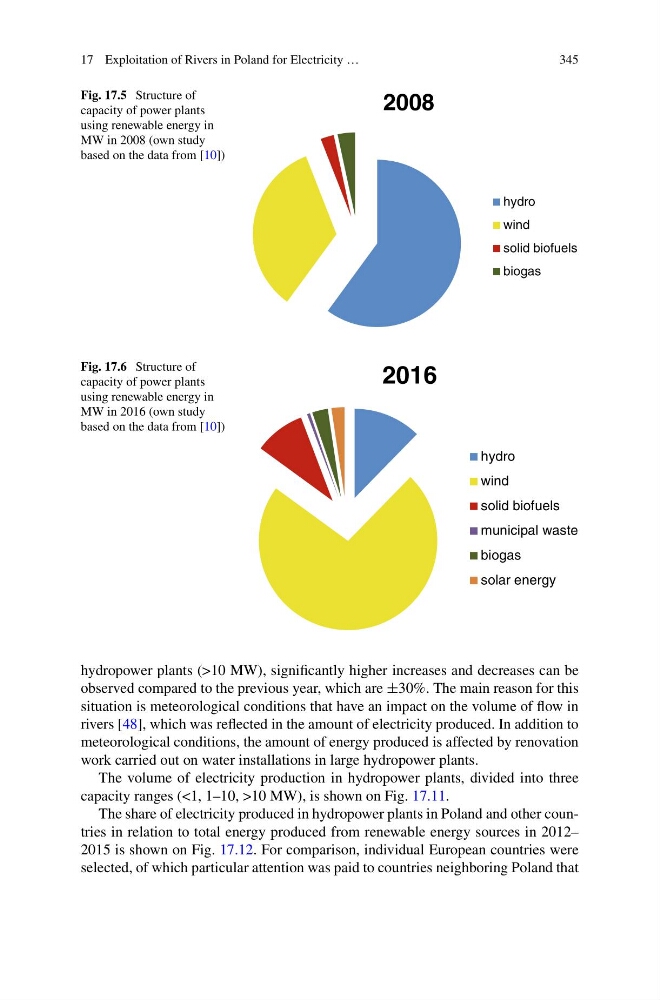
Fig. 17.5 Structure of
capacity of power plants
using renewable energy in
MW in 2008 (own study
based on the data from [10])
2008
hydro
wind
solid biofuels
biogas
Fig. 17.6 Structure of
capacity of power plants
using renewable energy in
MW in 2016 (own study
based on the data from [10])
2016
hydro
wind
solid biofuels
municipal waste
biogas
solar energy
hydropower plants (>10 MW), significantly higher increases and decreases can be
observed compared to the previous year, which are ±30%. The main reason for this
situation is meteorological conditions that have an impact on the volume of flow in
rivers [48], which was reflected in the amount of electricity produced. In addition to
meteorological conditions, the amount of energy produced is affected by renovation
work carried out on water installations in large hydropower plants.
The volume of electricity production in hydropower plants, divided into three
capacity ranges (<1, 1–10, >10 MW), is shown on Fig. 17.11.
The share of electricity produced in hydropower plants in Poland and other countries in relation to total energy produced from renewable energy sources in 2012–
2015 is shown on Fig. 17.12. For comparison, individual European countries were
selected, of which particular attention was paid to countries neighboring Poland that
345
Fig. 17.5 Structure of
capacity of power plants
using renewable energy in
MW in 2008 (own study
based on the data from [10])
2008
hydro
wind
solid biofuels
biogas
Fig. 17.6 Structure of
capacity of power plants
using renewable energy in
MW in 2016 (own study
based on the data from [10])
2016
hydro
wind
solid biofuels
municipal waste
biogas
solar energy
hydropower plants (>10 MW), significantly higher increases and decreases can be
observed compared to the previous year, which are ±30%. The main reason for this
situation is meteorological conditions that have an impact on the volume of flow in
rivers [48], which was reflected in the amount of electricity produced. In addition to
meteorological conditions, the amount of energy produced is affected by renovation
work carried out on water installations in large hydropower plants.
The volume of electricity production in hydropower plants, divided into three
capacity ranges (<1, 1–10, >10 MW), is shown on Fig. 17.11.
The share of electricity produced in hydropower plants in Poland and other countries in relation to total energy produced from renewable energy sources in 2012–
2015 is shown on Fig. 17.12. For comparison, individual European countries were
selected, of which particular attention was paid to countries neighboring Poland that