

16 Water Management in the Pomeranian Rivers Estuary Zone …
309
Varied wind conditions are the specificity of the studied area. The wind directions
and their seasonal variability are typical of the Polish Lowlands, which means that
the winds with the component of the western sector (SW, W, and NW) dominate.
However, there are relatively strong winds and a small number of windstill days.
The dichotomy of the region regarding wind speed is marked. The coastal zone (the
Koszali´ nskie, Słowi´ nskie and Kaszubskie Coastlands) has a high number of days with
strong and very strong wind, i.e., ≥10 and ≥15 m s
−1 . Winds of this type appear
mainly in the autumn and winter seasons and constitute over 19% of days a year.
Their share decreases towards the west coast (Kołobrzeg, ´
Swinouj´ scie) to 12–15%.
The strongest winds are recorded in Hel, Ustka, and Łeba. Inland, in the Pomeranian
Lake District, especially in ice-marginal valleys, there are generally winds of lower
velocity, thus the share of weak winds and wind-stagnant days increases. The incidence of days with winds exceeding the threshold of 10 m s
−1 decreases to about
3%.
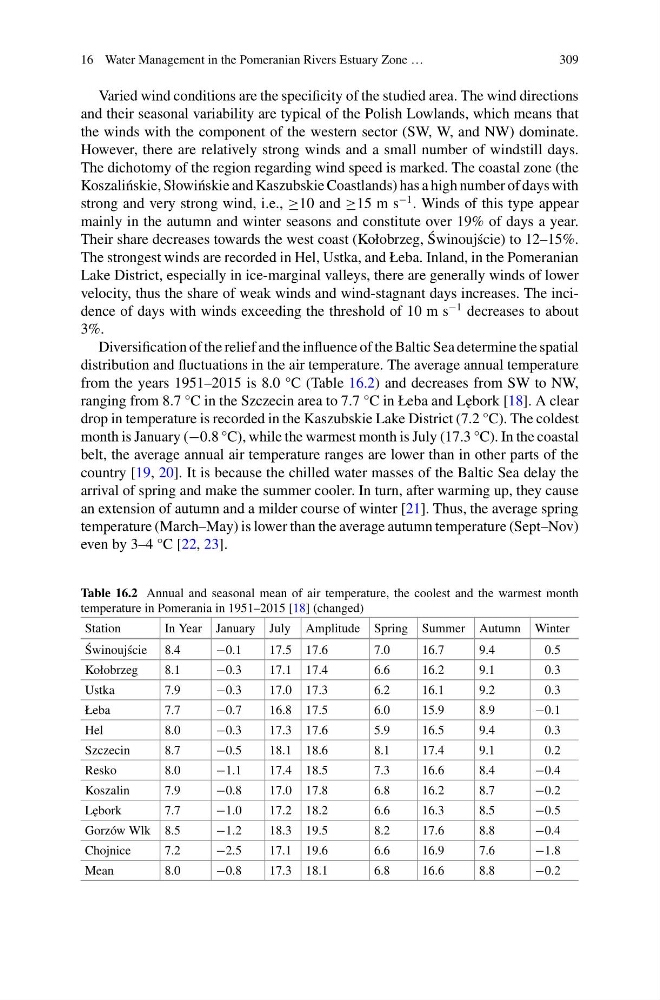
Diversification of the relief and the influence of the Baltic Sea determine the spatial
distribution and fluctuations in the air temperature. The average annual temperature
from the years 1951–2015 is 8.0 °C (Table 16.2) and decreases from SW to NW,
ranging from 8.7 °C in the Szczecin area to 7.7 °C in Łeba and L˛ ebork [18]. A clear
drop in temperature is recorded in the Kaszubskie Lake District (7.2 °C). The coldest
month is January (−0.8 °C), while the warmest month is July (17.3 °C). In the coastal
belt, the average annual air temperature ranges are lower than in other parts of the
country [19, 20]. It is because the chilled water masses of the Baltic Sea delay the
arrival of spring and make the summer cooler. In turn, after warming up, they cause
an extension of autumn and a milder course of winter [21]. Thus, the average spring
temperature (March–May) is lower than the average autumn temperature (Sept–Nov)
even by 3–4 °C [22, 23].
Table 16.2 Annual and seasonal mean of air temperature, the coolest and the warmest month
temperature in Pomerania in 1951–2015 [18] (changed)
Station
In Year January July Amplitude Spring Summer Autumn Winter
´
Swinouj´ scie 8.4
−0.1
17.5 17.6
7.0
16.7
9.4
0.5
Kołobrzeg
8.1
−0.3
17.1 17.4
6.6
16.2
9.1
0.3
Ustka
7.9
−0.3
17.0 17.3
6.2
16.1
9.2
0.3
Łeba
7.7
−0.7
16.8 17.5
6.0
15.9
8.9
−0.1
Hel
8.0
−0.3
17.3 17.6
5.9
16.5
9.4
0.3
Szczecin
8.7
−0.5
18.1 18.6
8.1
17.4
9.1
0.2
Resko
8.0
−1.1
17.4 18.5
7.3
16.6
8.4
−0.4
Koszalin
7.9
−0.8
17.0 17.8
6.8
16.2
8.7
−0.2
L˛ ebork
7.7
−1.0
17.2 18.2
6.6
16.3
8.5
−0.5
Gorzów Wlk 8.5
−1.2
18.3 19.5
8.2
17.6
8.8
−0.4
Chojnice
7.2
−2.5
17.1 19.6
6.6
16.9
7.6
−1.8
Mean
8.0
−0.8
17.3 18.1
6.8
16.6
8.8
−0.2
309
Varied wind conditions are the specificity of the studied area. The wind directions
and their seasonal variability are typical of the Polish Lowlands, which means that
the winds with the component of the western sector (SW, W, and NW) dominate.
However, there are relatively strong winds and a small number of windstill days.
The dichotomy of the region regarding wind speed is marked. The coastal zone (the
Koszali´ nskie, Słowi´ nskie and Kaszubskie Coastlands) has a high number of days with
strong and very strong wind, i.e., ≥10 and ≥15 m s
−1 . Winds of this type appear
mainly in the autumn and winter seasons and constitute over 19% of days a year.
Their share decreases towards the west coast (Kołobrzeg, ´
Swinouj´ scie) to 12–15%.
The strongest winds are recorded in Hel, Ustka, and Łeba. Inland, in the Pomeranian
Lake District, especially in ice-marginal valleys, there are generally winds of lower
velocity, thus the share of weak winds and wind-stagnant days increases. The incidence of days with winds exceeding the threshold of 10 m s
−1 decreases to about
3%.
Diversification of the relief and the influence of the Baltic Sea determine the spatial
distribution and fluctuations in the air temperature. The average annual temperature
from the years 1951–2015 is 8.0 °C (Table 16.2) and decreases from SW to NW,
ranging from 8.7 °C in the Szczecin area to 7.7 °C in Łeba and L˛ ebork [18]. A clear
drop in temperature is recorded in the Kaszubskie Lake District (7.2 °C). The coldest
month is January (−0.8 °C), while the warmest month is July (17.3 °C). In the coastal
belt, the average annual air temperature ranges are lower than in other parts of the
country [19, 20]. It is because the chilled water masses of the Baltic Sea delay the
arrival of spring and make the summer cooler. In turn, after warming up, they cause
an extension of autumn and a milder course of winter [21]. Thus, the average spring
temperature (March–May) is lower than the average autumn temperature (Sept–Nov)
even by 3–4 °C [22, 23].
Table 16.2 Annual and seasonal mean of air temperature, the coolest and the warmest month
temperature in Pomerania in 1951–2015 [18] (changed)
Station
In Year January July Amplitude Spring Summer Autumn Winter
´
Swinouj´ scie 8.4
−0.1
17.5 17.6
7.0
16.7
9.4
0.5
Kołobrzeg
8.1
−0.3
17.1 17.4
6.6
16.2
9.1
0.3
Ustka
7.9
−0.3
17.0 17.3
6.2
16.1
9.2
0.3
Łeba
7.7
−0.7
16.8 17.5
6.0
15.9
8.9
−0.1
Hel
8.0
−0.3
17.3 17.6
5.9
16.5
9.4
0.3
Szczecin
8.7
−0.5
18.1 18.6
8.1
17.4
9.1
0.2
Resko
8.0
−1.1
17.4 18.5
7.3
16.6
8.4
−0.4
Koszalin
7.9
−0.8
17.0 17.8
6.8
16.2
8.7
−0.2
L˛ ebork
7.7
−1.0
17.2 18.2
6.6
16.3
8.5
−0.5
Gorzów Wlk 8.5
−1.2
18.3 19.5
8.2
17.6
8.8
−0.4
Chojnice
7.2
−2.5
17.1 19.6
6.6
16.9
7.6
−1.8
Mean
8.0
−0.8
17.3 18.1
6.8
16.6
8.8
−0.2