

292
R. Graf
data, which are indispensable for deriving a hydrological model. Maps presenting
the results of the preliminary flood risk assessment were made for Poland in the
sale of 1:800,000 and in province division in the scales of 1:250,000, 1:300,000 and
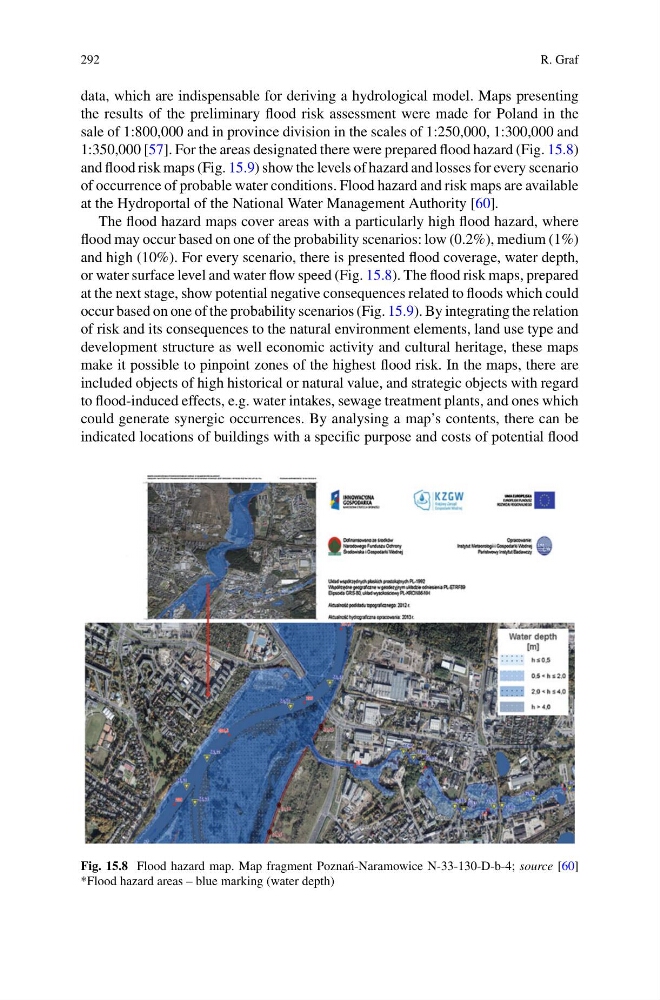
1:350,000 [57]. For the areas designated there were prepared flood hazard (Fig. 15.8)
and flood risk maps (Fig. 15.9) show the levels of hazard and losses for every scenario
of occurrence of probable water conditions. Flood hazard and risk maps are available
at the Hydroportal of the National Water Management Authority [60].
The flood hazard maps cover areas with a particularly high flood hazard, where
flood may occur based on one of the probability scenarios: low (0.2%), medium (1%)
and high (10%). For every scenario, there is presented flood coverage, water depth,
or water surface level and water flow speed (Fig. 15.8). The flood risk maps, prepared
at the next stage, show potential negative consequences related to floods which could
occur based on one of the probability scenarios (Fig. 15.9). By integrating the relation
of risk and its consequences to the natural environment elements, land use type and
development structure as well economic activity and cultural heritage, these maps
make it possible to pinpoint zones of the highest flood risk. In the maps, there are
included objects of high historical or natural value, and strategic objects with regard
to flood-induced effects, e.g. water intakes, sewage treatment plants, and ones which
could generate synergic occurrences. By analysing a map’s contents, there can be
indicated locations of buildings with a specific purpose and costs of potential flood
Fig. 15.8 Flood hazard map. Map fragment Pozna´ n-Naramowice N-33-130-D-b-4; source [60]
*Flood hazard areas – blue marking (water depth)
R. Graf
data, which are indispensable for deriving a hydrological model. Maps presenting
the results of the preliminary flood risk assessment were made for Poland in the
sale of 1:800,000 and in province division in the scales of 1:250,000, 1:300,000 and
1:350,000 [57]. For the areas designated there were prepared flood hazard (Fig. 15.8)
and flood risk maps (Fig. 15.9) show the levels of hazard and losses for every scenario
of occurrence of probable water conditions. Flood hazard and risk maps are available
at the Hydroportal of the National Water Management Authority [60].
The flood hazard maps cover areas with a particularly high flood hazard, where
flood may occur based on one of the probability scenarios: low (0.2%), medium (1%)
and high (10%). For every scenario, there is presented flood coverage, water depth,
or water surface level and water flow speed (Fig. 15.8). The flood risk maps, prepared
at the next stage, show potential negative consequences related to floods which could
occur based on one of the probability scenarios (Fig. 15.9). By integrating the relation
of risk and its consequences to the natural environment elements, land use type and
development structure as well economic activity and cultural heritage, these maps
make it possible to pinpoint zones of the highest flood risk. In the maps, there are
included objects of high historical or natural value, and strategic objects with regard
to flood-induced effects, e.g. water intakes, sewage treatment plants, and ones which
could generate synergic occurrences. By analysing a map’s contents, there can be
indicated locations of buildings with a specific purpose and costs of potential flood
Fig. 15.8 Flood hazard map. Map fragment Pozna´ n-Naramowice N-33-130-D-b-4; source [60]
*Flood hazard areas – blue marking (water depth)