

13 Flood Marks in Poland and Their Significance in Water …
255
in Toru´ n. The goal of that project was to catalogue high water marks in Poland in
order to determine the frequency of historical floods and make viable prognosis for
their occurrences in the future. It also included the assessment of the efficiency of the
hydro-technical installations and flood-protection systems, as well as the assessment
of the flood risks in the conditions of climate change, transformations in the management and utilization of drainage basins, and bringing awareness to the significance of
the threat presented by floods. The platform used for the gathering and the exchange
of information was a website [21], where any person interested in the subject could
contribute to the creation of a comprehensive database, which would be used for
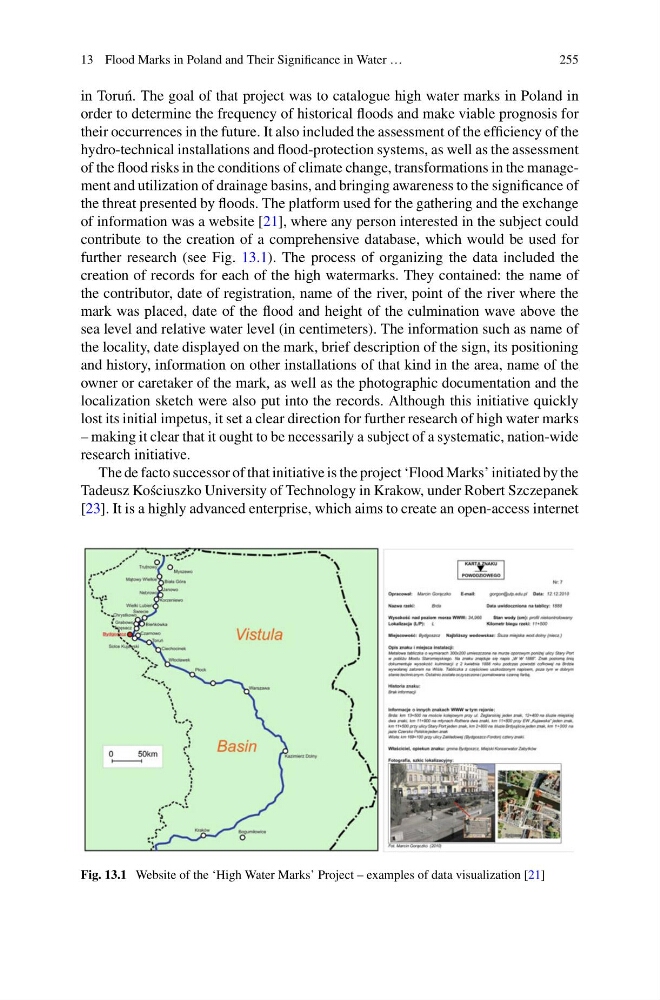
further research (see Fig. 13.1). The process of organizing the data included the
creation of records for each of the high watermarks. They contained: the name of
the contributor, date of registration, name of the river, point of the river where the
mark was placed, date of the flood and height of the culmination wave above the
sea level and relative water level (in centimeters). The information such as name of
the locality, date displayed on the mark, brief description of the sign, its positioning
and history, information on other installations of that kind in the area, name of the
owner or caretaker of the mark, as well as the photographic documentation and the
localization sketch were also put into the records. Although this initiative quickly
lost its initial impetus, it set a clear direction for further research of high water marks
– making it clear that it ought to be necessarily a subject of a systematic, nation-wide
research initiative.
The de facto successor of that initiative is the project ‘Flood Marks’ initiated by the
Tadeusz Ko´ sciuszko University of Technology in Krakow, under Robert Szczepanek
[23]. It is a highly advanced enterprise, which aims to create an open-access internet
Fig. 13.1 Website of the ‘High Water Marks’ Project – examples of data visualization [21]
255
in Toru´ n. The goal of that project was to catalogue high water marks in Poland in
order to determine the frequency of historical floods and make viable prognosis for
their occurrences in the future. It also included the assessment of the efficiency of the
hydro-technical installations and flood-protection systems, as well as the assessment
of the flood risks in the conditions of climate change, transformations in the management and utilization of drainage basins, and bringing awareness to the significance of
the threat presented by floods. The platform used for the gathering and the exchange
of information was a website [21], where any person interested in the subject could
contribute to the creation of a comprehensive database, which would be used for
further research (see Fig. 13.1). The process of organizing the data included the
creation of records for each of the high watermarks. They contained: the name of
the contributor, date of registration, name of the river, point of the river where the
mark was placed, date of the flood and height of the culmination wave above the
sea level and relative water level (in centimeters). The information such as name of
the locality, date displayed on the mark, brief description of the sign, its positioning
and history, information on other installations of that kind in the area, name of the
owner or caretaker of the mark, as well as the photographic documentation and the
localization sketch were also put into the records. Although this initiative quickly
lost its initial impetus, it set a clear direction for further research of high water marks
– making it clear that it ought to be necessarily a subject of a systematic, nation-wide
research initiative.
The de facto successor of that initiative is the project ‘Flood Marks’ initiated by the
Tadeusz Ko´ sciuszko University of Technology in Krakow, under Robert Szczepanek
[23]. It is a highly advanced enterprise, which aims to create an open-access internet
Fig. 13.1 Website of the ‘High Water Marks’ Project – examples of data visualization [21]