

12 Dynamics, Range, and Severity of Hydrological …
247
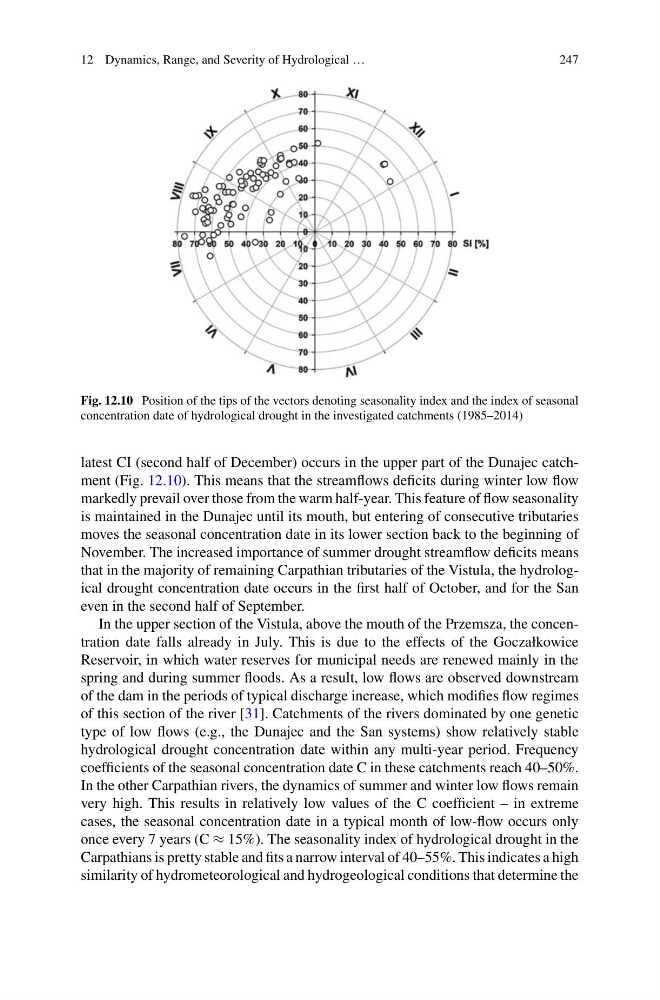
Fig. 12.10 Position of the tips of the vectors denoting seasonality index and the index of seasonal
concentration date of hydrological drought in the investigated catchments (1985–2014)
latest CI (second half of December) occurs in the upper part of the Dunajec catchment (Fig. 12.10). This means that the streamflows deficits during winter low flow
markedly prevail over those from the warm half-year. This feature of flow seasonality
is maintained in the Dunajec until its mouth, but entering of consecutive tributaries
moves the seasonal concentration date in its lower section back to the beginning of
November. The increased importance of summer drought streamflow deficits means
that in the majority of remaining Carpathian tributaries of the Vistula, the hydrological drought concentration date occurs in the first half of October, and for the San
even in the second half of September.
In the upper section of the Vistula, above the mouth of the Przemsza, the concentration date falls already in July. This is due to the effects of the Goczałkowice
Reservoir, in which water reserves for municipal needs are renewed mainly in the
spring and during summer floods. As a result, low flows are observed downstream
of the dam in the periods of typical discharge increase, which modifies flow regimes
of this section of the river [31]. Catchments of the rivers dominated by one genetic
type of low flows (e.g., the Dunajec and the San systems) show relatively stable
hydrological drought concentration date within any multi-year period. Frequency
coefficients of the seasonal concentration date C in these catchments reach 40–50%.
In the other Carpathian rivers, the dynamics of summer and winter low flows remain
very high. This results in relatively low values of the C coefficient – in extreme
cases, the seasonal concentration date in a typical month of low-flow occurs only
once every 7 years (C ≈ 15%). The seasonality index of hydrological drought in the
Carpathians is pretty stable and fits a narrow interval of 40–55%. This indicates a high
similarity of hydrometeorological and hydrogeological conditions that determine the
247
Fig. 12.10 Position of the tips of the vectors denoting seasonality index and the index of seasonal
concentration date of hydrological drought in the investigated catchments (1985–2014)
latest CI (second half of December) occurs in the upper part of the Dunajec catchment (Fig. 12.10). This means that the streamflows deficits during winter low flow
markedly prevail over those from the warm half-year. This feature of flow seasonality
is maintained in the Dunajec until its mouth, but entering of consecutive tributaries
moves the seasonal concentration date in its lower section back to the beginning of
November. The increased importance of summer drought streamflow deficits means
that in the majority of remaining Carpathian tributaries of the Vistula, the hydrological drought concentration date occurs in the first half of October, and for the San
even in the second half of September.
In the upper section of the Vistula, above the mouth of the Przemsza, the concentration date falls already in July. This is due to the effects of the Goczałkowice
Reservoir, in which water reserves for municipal needs are renewed mainly in the
spring and during summer floods. As a result, low flows are observed downstream
of the dam in the periods of typical discharge increase, which modifies flow regimes
of this section of the river [31]. Catchments of the rivers dominated by one genetic
type of low flows (e.g., the Dunajec and the San systems) show relatively stable
hydrological drought concentration date within any multi-year period. Frequency
coefficients of the seasonal concentration date C in these catchments reach 40–50%.
In the other Carpathian rivers, the dynamics of summer and winter low flows remain
very high. This results in relatively low values of the C coefficient – in extreme
cases, the seasonal concentration date in a typical month of low-flow occurs only
once every 7 years (C ≈ 15%). The seasonality index of hydrological drought in the
Carpathians is pretty stable and fits a narrow interval of 40–55%. This indicates a high
similarity of hydrometeorological and hydrogeological conditions that determine the