

208
E. Tomaszewski and K. Kubiak-Wójcicka
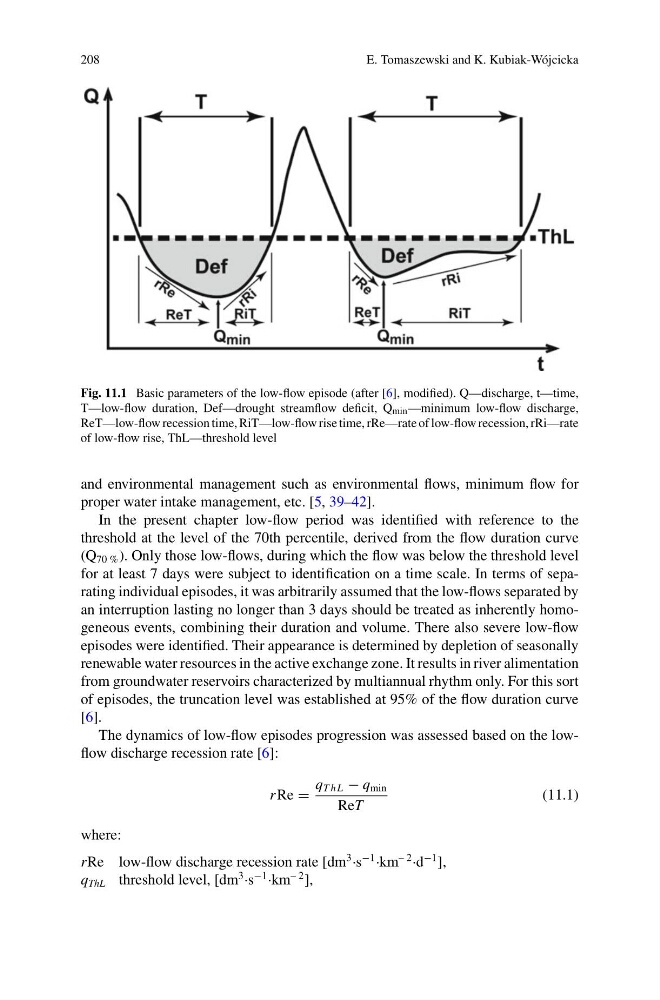
Fig. 11.1 Basic parameters of the low-flow episode (after [6], modified). Q—discharge, t—time,
T—low-flow duration, Def—drought streamflow deficit, Q min —minimum low-flow discharge,
ReT—low-flow recession time, RiT—low-flow rise time, rRe—rate of low-flow recession, rRi—rate
of low-flow rise, ThL—threshold level
and environmental management such as environmental flows, minimum flow for
proper water intake management, etc. [5, 39–42].
In the present chapter low-flow period was identified with reference to the
threshold at the level of the 70th percentile, derived from the flow duration curve
(Q 70 % ). Only those low-flows, during which the flow was below the threshold level
for at least 7 days were subject to identification on a time scale. In terms of separating individual episodes, it was arbitrarily assumed that the low-flows separated by
an interruption lasting no longer than 3 days should be treated as inherently homogeneous events, combining their duration and volume. There also severe low-flow
episodes were identified. Their appearance is determined by depletion of seasonally
renewable water resources in the active exchange zone. It results in river alimentation
from groundwater reservoirs characterized by multiannual rhythm only. For this sort
of episodes, the truncation level was established at 95% of the flow duration curve
[6].
The dynamics of low-flow episodes progression was assessed based on the lowflow discharge recession rate [6]:
r Re =
q T hL − q min
ReT
(11.1)
where:
rRe low-flow discharge recession rate [dm
3 ·s
−1 ·km
– 2 ·d
−1 ],
q ThL threshold level, [dm
3 ·s
−1 ·km
– 2 ],
E. Tomaszewski and K. Kubiak-Wójcicka
Fig. 11.1 Basic parameters of the low-flow episode (after [6], modified). Q—discharge, t—time,
T—low-flow duration, Def—drought streamflow deficit, Q min —minimum low-flow discharge,
ReT—low-flow recession time, RiT—low-flow rise time, rRe—rate of low-flow recession, rRi—rate
of low-flow rise, ThL—threshold level
and environmental management such as environmental flows, minimum flow for
proper water intake management, etc. [5, 39–42].
In the present chapter low-flow period was identified with reference to the
threshold at the level of the 70th percentile, derived from the flow duration curve
(Q 70 % ). Only those low-flows, during which the flow was below the threshold level
for at least 7 days were subject to identification on a time scale. In terms of separating individual episodes, it was arbitrarily assumed that the low-flows separated by
an interruption lasting no longer than 3 days should be treated as inherently homogeneous events, combining their duration and volume. There also severe low-flow
episodes were identified. Their appearance is determined by depletion of seasonally
renewable water resources in the active exchange zone. It results in river alimentation
from groundwater reservoirs characterized by multiannual rhythm only. For this sort
of episodes, the truncation level was established at 95% of the flow duration curve
[6].
The dynamics of low-flow episodes progression was assessed based on the lowflow discharge recession rate [6]:
r Re =
q T hL − q min
ReT
(11.1)
where:
rRe low-flow discharge recession rate [dm
3 ·s
−1 ·km
– 2 ·d
−1 ],
q ThL threshold level, [dm
3 ·s
−1 ·km
– 2 ],