

10 Flow Seasonality in Two Big Polish Rivers – The Vistula …
195
changes. Huge increase in the Vistula flow and catchment area after inclusion of the
Narew and the Bug does not enhance the river flow seasonality. On the contrary, IS
of the Vistula below the mouth of the Narew is reduced, proving that the seasonal
structure of the Narew and the Bug flow is similar to that of the Vistula at the gauges
located above the mouth of the Narew. Similar patterns, although less visible, are
also observed for GMO changes along the Vistula course.
Concentration date (PK) and half-flow date (TPO) gradually decrease with the
increasing length of the Vistula and the area of its basin. Therefore, the river flow
seasonality is significantly reduced. These trends can even by described by statistically significant (α = 1%; F-Snedecor test) regression equations as functions of the
river chainage (Fig. 10.4a and c) and catchment area (Fig. 10.4b and d). Statistical
errors of the equations are large, but the determination coefficients (R
2 ) in all cases
indicate a good or very good degree of explanation. A slightly better match of the
equations was obtained for TPO and its correlation with the catchment area (A w )
than for PK and the Vistula length (L w ).
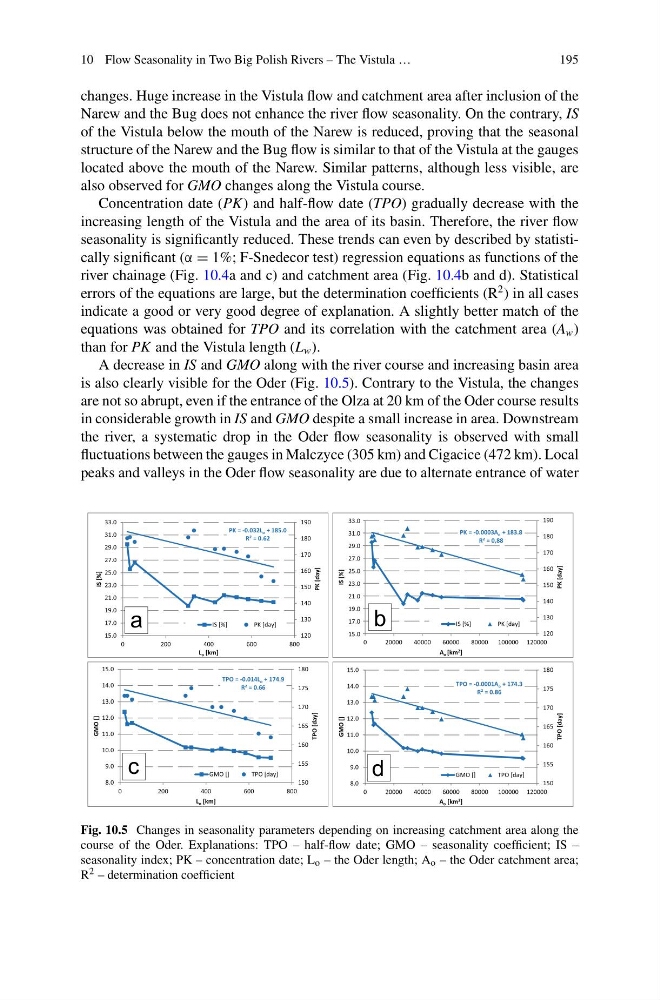
A decrease in IS and GMO along with the river course and increasing basin area
is also clearly visible for the Oder (Fig. 10.5). Contrary to the Vistula, the changes
are not so abrupt, even if the entrance of the Olza at 20 km of the Oder course results
in considerable growth in IS and GMO despite a small increase in area. Downstream
the river, a systematic drop in the Oder flow seasonality is observed with small
fluctuations between the gauges in Malczyce (305 km) and Cigacice (472 km). Local
peaks and valleys in the Oder flow seasonality are due to alternate entrance of water
TPO = -0.014L o + 174.9
R² = 0.66
150
155
160
165
170
175
180
8.0
9.0
10.0
11.0
12.0
13.0
14.0
15.0
0
200
400
600
800
TPO [day]
GMO []
L o [km]
GMO []
TPO [day]
PK = -0.0003A o + 183.8
R² = 0,88
120
130
140
150
160
170
180
190
0
20000
40000
60000
80000 100000 120000
PK [day]
IS [%]
A o [km 2 ]
IS [%]
PK [day]
PK = -0.032L o + 185.0
R² = 0.62
120
130
140
150
160
170
180
190
15.0
17.0
19.0
21.0
23.0
25.0
27.0
29.0
31.0
33.0
0
200
400
600
800
PK [day]
IS [%]
L o [km]
IS [%]
PK [day]
a
b
c
TPO = -0.0001A o + 174.3
R² = 0.86
150
155
160
165
170
175
180
0
20000
40000
60000
80000 100000 120000
TPO [day]
GMO []
A o [km 2 ]
GMO []
TPO [day]
d
15.0
17.0
19.0
21.0
23.0
25.0
27.0
29.0
31.0
33.0
8.0
9.0
10.0
11.0
12.0
13.0
14.0
15.0
Fig. 10.5 Changes in seasonality parameters depending on increasing catchment area along the
course of the Oder. Explanations: TPO – half-flow date; GMO – seasonality coefficient; IS –
seasonality index; PK – concentration date; L o – the Oder length; A o – the Oder catchment area;
R 2 – determination coefficient
195
changes. Huge increase in the Vistula flow and catchment area after inclusion of the
Narew and the Bug does not enhance the river flow seasonality. On the contrary, IS
of the Vistula below the mouth of the Narew is reduced, proving that the seasonal
structure of the Narew and the Bug flow is similar to that of the Vistula at the gauges
located above the mouth of the Narew. Similar patterns, although less visible, are
also observed for GMO changes along the Vistula course.
Concentration date (PK) and half-flow date (TPO) gradually decrease with the
increasing length of the Vistula and the area of its basin. Therefore, the river flow
seasonality is significantly reduced. These trends can even by described by statistically significant (α = 1%; F-Snedecor test) regression equations as functions of the
river chainage (Fig. 10.4a and c) and catchment area (Fig. 10.4b and d). Statistical
errors of the equations are large, but the determination coefficients (R
2 ) in all cases
indicate a good or very good degree of explanation. A slightly better match of the
equations was obtained for TPO and its correlation with the catchment area (A w )
than for PK and the Vistula length (L w ).
A decrease in IS and GMO along with the river course and increasing basin area
is also clearly visible for the Oder (Fig. 10.5). Contrary to the Vistula, the changes
are not so abrupt, even if the entrance of the Olza at 20 km of the Oder course results
in considerable growth in IS and GMO despite a small increase in area. Downstream
the river, a systematic drop in the Oder flow seasonality is observed with small
fluctuations between the gauges in Malczyce (305 km) and Cigacice (472 km). Local
peaks and valleys in the Oder flow seasonality are due to alternate entrance of water
TPO = -0.014L o + 174.9
R² = 0.66
150
155
160
165
170
175
180
8.0
9.0
10.0
11.0
12.0
13.0
14.0
15.0
0
200
400
600
800
TPO [day]
GMO []
L o [km]
GMO []
TPO [day]
PK = -0.0003A o + 183.8
R² = 0,88
120
130
140
150
160
170
180
190
0
20000
40000
60000
80000 100000 120000
PK [day]
IS [%]
A o [km 2 ]
IS [%]
PK [day]
PK = -0.032L o + 185.0
R² = 0.62
120
130
140
150
160
170
180
190
15.0
17.0
19.0
21.0
23.0
25.0
27.0
29.0
31.0
33.0
0
200
400
600
800
PK [day]
IS [%]
L o [km]
IS [%]
PK [day]
a
b
c
TPO = -0.0001A o + 174.3
R² = 0.86
150
155
160
165
170
175
180
0
20000
40000
60000
80000 100000 120000
TPO [day]
GMO []
A o [km 2 ]
GMO []
TPO [day]
d
15.0
17.0
19.0
21.0
23.0
25.0
27.0
29.0
31.0
33.0
8.0
9.0
10.0
11.0
12.0
13.0
14.0
15.0
Fig. 10.5 Changes in seasonality parameters depending on increasing catchment area along the
course of the Oder. Explanations: TPO – half-flow date; GMO – seasonality coefficient; IS –
seasonality index; PK – concentration date; L o – the Oder length; A o – the Oder catchment area;
R 2 – determination coefficient