

194
P. Jokiel and P. Tomalski
IS = -0.25GMO 2 + 8.31GMO - 36.26
R² = 0.82
17.0
22.0
27.0
32.0
37.0
8.0
9.0
10.0
11.0
12.0
13.0
14.0
15.0
16.0
GMO/IS (All watergauges)
GMO [ ]
IS [%]
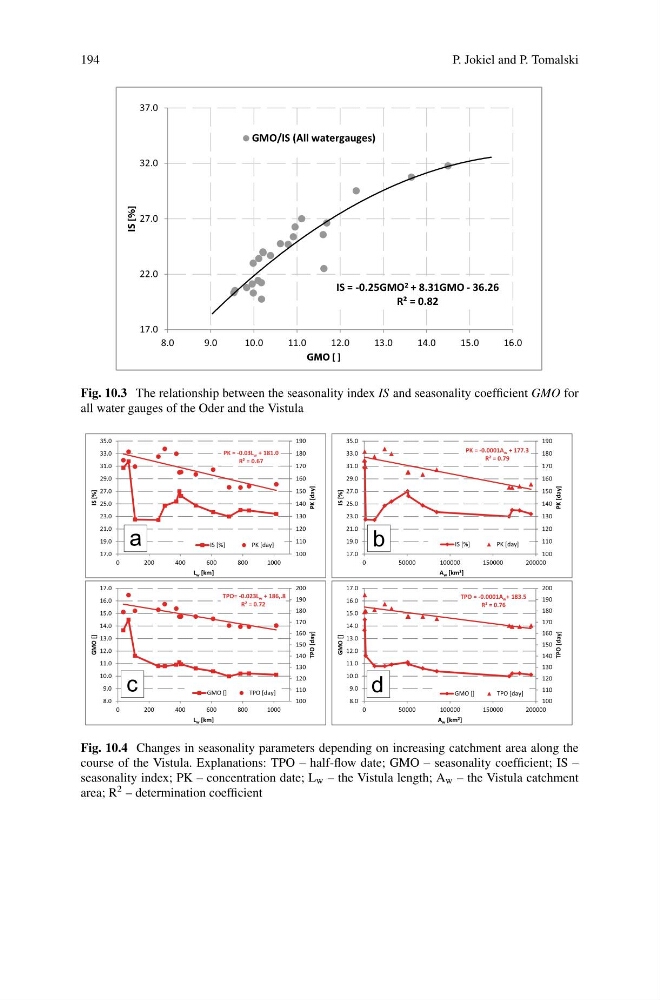
Fig. 10.3 The relationship between the seasonality index IS and seasonality coefficient GMO for
all water gauges of the Oder and the Vistula
PK = -0.03L w + 181.0
R² = 0.67
100
110
120
130
140
150
160
170
180
190
17.0
19.0
21.0
23.0
25.0
27.0
29.0
31.0
33.0
35.0
0
200
400
600
800
1000
PK [day]
IS [%]
L w [km]
IS [%]
PK [day]
PK = -0.0001A w + 177.3
R² = 0.79
100
110
120
130
140
150
160
170
180
190
17.0
19.0
21.0
23.0
25.0
27.0
29.0
31.0
33.0
35.0
0
50000
100000
150000
200000
PK [day]
IS [%]
A w [km 2 ]
IS [%]
PK [day]
TPO= -0.023L w + 186,.8
R² = 0.72
100
110
120
130
140
150
160
170
180
190
200
8.0
9.0
10.0
11.0
12.0
13.0
14.0
15.0
16.0
17.0
0
200
400
600
800
1000
TPO [day]
GMO []
L w [km]
GMO []
TPO [day]
TPO = -0.0001A w + 183.5
R² = 0.76
100
110
120
130
140
150
160
170
180
190
200
8.0
9.0
10.0
11.0
12.0
13.0
14.0
15.0
16.0
17.0
0
50000
100000
150000
200000
TPO [day]
GMO []
A w [km 2 ]
GMO []
TPO [day]
a
b
c
d
Fig. 10.4 Changes in seasonality parameters depending on increasing catchment area along the
course of the Vistula. Explanations: TPO – half-flow date; GMO – seasonality coefficient; IS –
seasonality index; PK – concentration date; L w – the Vistula length; A w – the Vistula catchment
area; R 2 – determination coefficient
P. Jokiel and P. Tomalski
IS = -0.25GMO 2 + 8.31GMO - 36.26
R² = 0.82
17.0
22.0
27.0
32.0
37.0
8.0
9.0
10.0
11.0
12.0
13.0
14.0
15.0
16.0
GMO/IS (All watergauges)
GMO [ ]
IS [%]
Fig. 10.3 The relationship between the seasonality index IS and seasonality coefficient GMO for
all water gauges of the Oder and the Vistula
PK = -0.03L w + 181.0
R² = 0.67
100
110
120
130
140
150
160
170
180
190
17.0
19.0
21.0
23.0
25.0
27.0
29.0
31.0
33.0
35.0
0
200
400
600
800
1000
PK [day]
IS [%]
L w [km]
IS [%]
PK [day]
PK = -0.0001A w + 177.3
R² = 0.79
100
110
120
130
140
150
160
170
180
190
17.0
19.0
21.0
23.0
25.0
27.0
29.0
31.0
33.0
35.0
0
50000
100000
150000
200000
PK [day]
IS [%]
A w [km 2 ]
IS [%]
PK [day]
TPO= -0.023L w + 186,.8
R² = 0.72
100
110
120
130
140
150
160
170
180
190
200
8.0
9.0
10.0
11.0
12.0
13.0
14.0
15.0
16.0
17.0
0
200
400
600
800
1000
TPO [day]
GMO []
L w [km]
GMO []
TPO [day]
TPO = -0.0001A w + 183.5
R² = 0.76
100
110
120
130
140
150
160
170
180
190
200
8.0
9.0
10.0
11.0
12.0
13.0
14.0
15.0
16.0
17.0
0
50000
100000
150000
200000
TPO [day]
GMO []
A w [km 2 ]
GMO []
TPO [day]
a
b
c
d
Fig. 10.4 Changes in seasonality parameters depending on increasing catchment area along the
course of the Vistula. Explanations: TPO – half-flow date; GMO – seasonality coefficient; IS –
seasonality index; PK – concentration date; L w – the Vistula length; A w – the Vistula catchment
area; R 2 – determination coefficient