

10 Flow Seasonality in Two Big Polish Rivers – The Vistula …
187
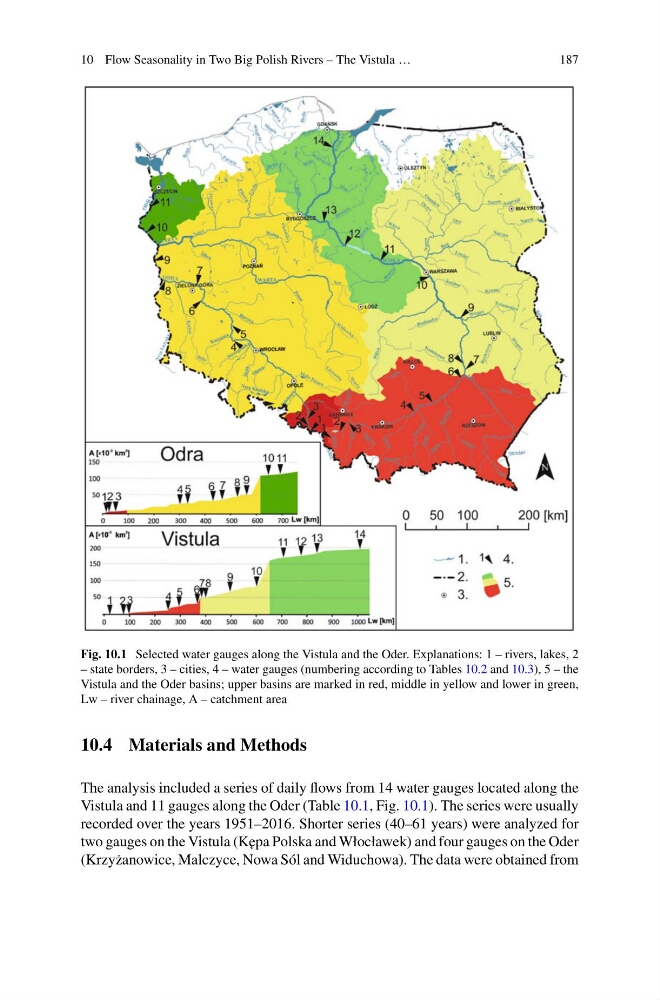
Fig. 10.1 Selected water gauges along the Vistula and the Oder. Explanations: 1 – rivers, lakes, 2
– state borders, 3 – cities, 4 – water gauges (numbering according to Tables 10.2 and 10.3), 5 – the
Vistula and the Oder basins; upper basins are marked in red, middle in yellow and lower in green,
Lw – river chainage, A – catchment area
10.4 Materials and Methods
The analysis included a series of daily flows from 14 water gauges located along the
Vistula and 11 gauges along the Oder (Table 10.1, Fig. 10.1). The series were usually
recorded over the years 1951–2016. Shorter series (40–61 years) were analyzed for
two gauges on the Vistula (K˛ epa Polska and Włocławek) and four gauges on the Oder
(Krzy˙ zanowice, Malczyce, Nowa Sól and Widuchowa). The data were obtained from
187
Fig. 10.1 Selected water gauges along the Vistula and the Oder. Explanations: 1 – rivers, lakes, 2
– state borders, 3 – cities, 4 – water gauges (numbering according to Tables 10.2 and 10.3), 5 – the
Vistula and the Oder basins; upper basins are marked in red, middle in yellow and lower in green,
Lw – river chainage, A – catchment area
10.4 Materials and Methods
The analysis included a series of daily flows from 14 water gauges located along the
Vistula and 11 gauges along the Oder (Table 10.1, Fig. 10.1). The series were usually
recorded over the years 1951–2016. Shorter series (40–61 years) were analyzed for
two gauges on the Vistula (K˛ epa Polska and Włocławek) and four gauges on the Oder
(Krzy˙ zanowice, Malczyce, Nowa Sól and Widuchowa). The data were obtained from