

1 Foundation of Fluid Mechanics
61
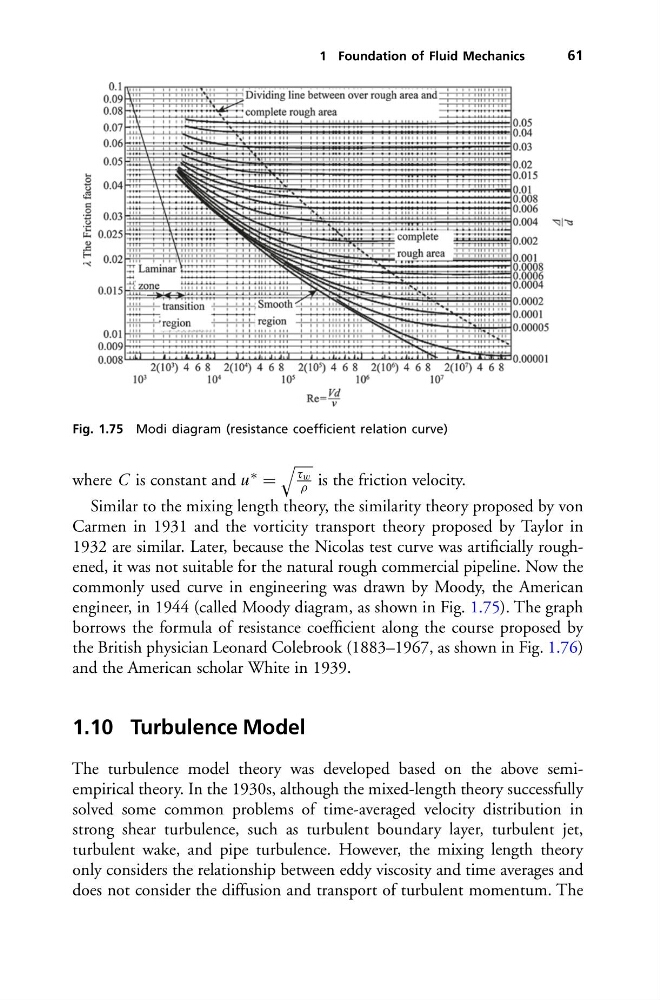
Fig. 1.75 Modi diagram (resistance coefficient relation curve)
where C is constant and u ∗ =
τ w
ρ is the friction velocity.
Similar to the mixing length theory, the similarity theory proposed by von
Carmen in 1931 and the vorticity transport theory proposed by Taylor in
1932 are similar. Later, because the Nicolas test curve was artificially roughened, it was not suitable for the natural rough commercial pipeline. Now the
commonly used curve in engineering was drawn by Moody, the American
engineer, in 1944 (called Moody diagram, as shown in Fig. 1.75). The graph
borrows the formula of resistance coefficient along the course proposed by
the British physician Leonard Colebrook (1883–1967, as shown in Fig. 1.76)
and the American scholar White in 1939.
1.10 Turbulence Model
The turbulence model theory was developed based on the above semiempirical theory. In the 1930s, although the mixed-length theory successfully
solved some common problems of time-averaged velocity distribution in
strong shear turbulence, such as turbulent boundary layer, turbulent jet,
turbulent wake, and pipe turbulence. However, the mixing length theory
only considers the relationship between eddy viscosity and time averages and
does not consider the diffusion and transport of turbulent momentum. The
61
Fig. 1.75 Modi diagram (resistance coefficient relation curve)
where C is constant and u ∗ =
τ w
ρ is the friction velocity.
Similar to the mixing length theory, the similarity theory proposed by von
Carmen in 1931 and the vorticity transport theory proposed by Taylor in
1932 are similar. Later, because the Nicolas test curve was artificially roughened, it was not suitable for the natural rough commercial pipeline. Now the
commonly used curve in engineering was drawn by Moody, the American
engineer, in 1944 (called Moody diagram, as shown in Fig. 1.75). The graph
borrows the formula of resistance coefficient along the course proposed by
the British physician Leonard Colebrook (1883–1967, as shown in Fig. 1.76)
and the American scholar White in 1939.
1.10 Turbulence Model
The turbulence model theory was developed based on the above semiempirical theory. In the 1930s, although the mixed-length theory successfully
solved some common problems of time-averaged velocity distribution in
strong shear turbulence, such as turbulent boundary layer, turbulent jet,
turbulent wake, and pipe turbulence. However, the mixing length theory
only considers the relationship between eddy viscosity and time averages and
does not consider the diffusion and transport of turbulent momentum. The