

488
a higher yield of methane and lower yield of C 2 fraction. The two models were
derived based on the assumption that the entire range of FT products was a combination of two ASF product distribution with two different chain growth factors. The
theory was supported by the experimental results where the occurrence of two active
sites or two parallel mechanisms were verified [111, 112, 114]. The two α models
were not able to explain the relationship between decreasing olefin/paraffin ratio
with carbon number and the two different values of α [111, 115]. Also, the two α
product distribution model gives the best results for carbon number n > 3. The deviation in C 1 and C 2 yields in the distribution cannot be explained using the model.
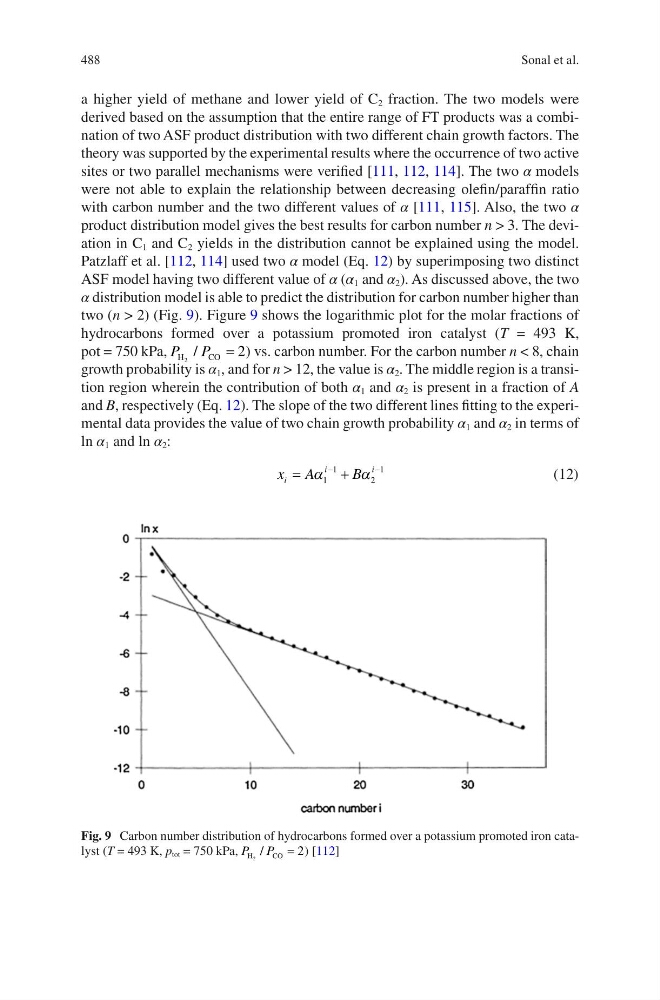
Patzlaff et al. [112, 114] used two α model (Eq. 12) by superimposing two distinct
ASF model having two different value of α (α 1 and α 2 ). As discussed above, the two
α distribution model is able to predict the distribution for carbon number higher than
two (n > 2) (Fig. 9). Figure 9 shows the logarithmic plot for the molar fractions of
hydrocarbons formed over a potassium promoted iron catalyst (T = 493 K,
pot = 750 kPa, P P
H
C O
2
2
/
= ) vs. carbon number. For the carbon number n < 8, chain
growth probability is α 1 , and for n > 12, the value is α 2 . The middle region is a transition region wherein the contribution of both α 1 and α 2 is present in a fraction of A
and B, respectively (Eq. 12). The slope of the two different lines fitting to the experimental data provides the value of two chain growth probability α 1 and α 2 in terms of
ln α 1 and ln α 2 :
x A
B
i
i
i
=
+
−
−
α
α
1
1
2
1
(12)
Fig. 9 Carbon number distribution of hydrocarbons formed over a potassium promoted iron catalyst (T = 493 K, p tot = 750 kPa, P P
H
C O
2
2
/
= ) [112]
Sonal et al.
a higher yield of methane and lower yield of C 2 fraction. The two models were
derived based on the assumption that the entire range of FT products was a combination of two ASF product distribution with two different chain growth factors. The
theory was supported by the experimental results where the occurrence of two active
sites or two parallel mechanisms were verified [111, 112, 114]. The two α models
were not able to explain the relationship between decreasing olefin/paraffin ratio
with carbon number and the two different values of α [111, 115]. Also, the two α
product distribution model gives the best results for carbon number n > 3. The deviation in C 1 and C 2 yields in the distribution cannot be explained using the model.
Patzlaff et al. [112, 114] used two α model (Eq. 12) by superimposing two distinct
ASF model having two different value of α (α 1 and α 2 ). As discussed above, the two
α distribution model is able to predict the distribution for carbon number higher than
two (n > 2) (Fig. 9). Figure 9 shows the logarithmic plot for the molar fractions of
hydrocarbons formed over a potassium promoted iron catalyst (T = 493 K,
pot = 750 kPa, P P
H
C O
2
2
/
= ) vs. carbon number. For the carbon number n < 8, chain
growth probability is α 1 , and for n > 12, the value is α 2 . The middle region is a transition region wherein the contribution of both α 1 and α 2 is present in a fraction of A
and B, respectively (Eq. 12). The slope of the two different lines fitting to the experimental data provides the value of two chain growth probability α 1 and α 2 in terms of
ln α 1 and ln α 2 :
x A
B
i
i
i
=
+
−
−
α
α
1
1
2
1
(12)
Fig. 9 Carbon number distribution of hydrocarbons formed over a potassium promoted iron catalyst (T = 493 K, p tot = 750 kPa, P P
H
C O
2
2
/
= ) [112]
Sonal et al.