

486
molar fraction value. The logarithmic form of Eq. (9) is a more generalized form of
the ASF distribution model and as shown below (Eq.10):
log
l og
log
M
n
n = ⋅
+
−
(
)
α
α
α
1
(10)
The value of the chain growth probability factor can also be determined from the
ratio of the molar fraction of the two products with different carbon numbers using
experimental data (Eq. 11):
M
M
n
k
n k
=
−
( )
α
(11)
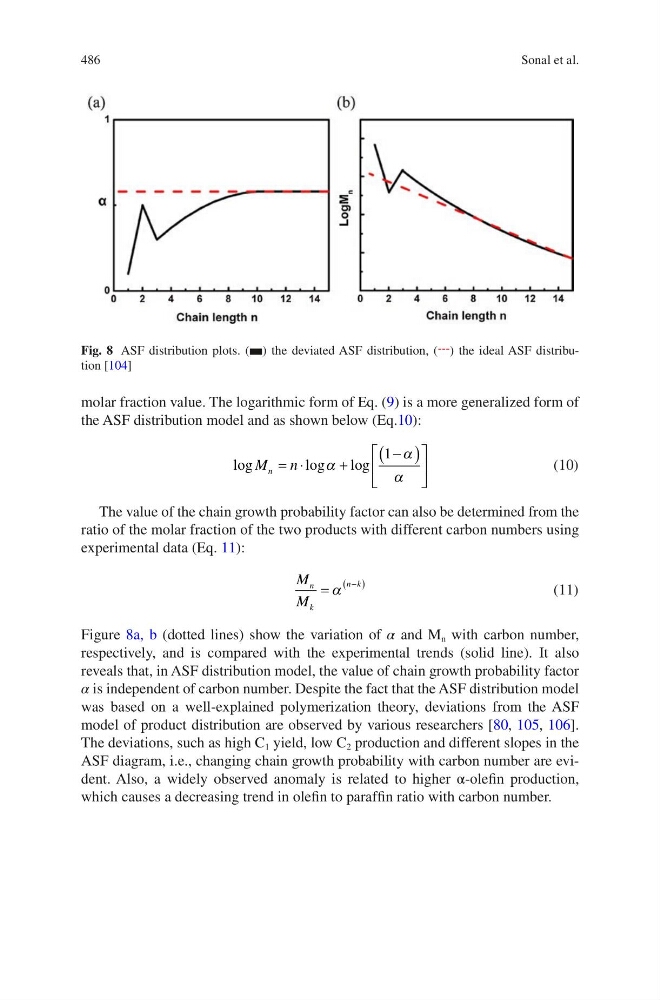
Figure 8a, b (dotted lines) show the variation of α and M n with carbon number,
respectively, and is compared with the experimental trends (solid line). It also
reveals that, in ASF distribution model, the value of chain growth probability factor
α is independent of carbon number. Despite the fact that the ASF distribution model
was based on a well-explained polymerization theory, deviations from the ASF
model of product distribution are observed by various researchers [80, 105, 106].
The deviations, such as high C 1 yield, low C 2 production and different slopes in the
ASF diagram, i.e., changing chain growth probability with carbon number are evident. Also, a widely observed anomaly is related to higher α-olefin production,
which causes a decreasing trend in olefin to paraffin ratio with carbon number.
Fig. 8 ASF distribution plots. (▬) the deviated ASF distribution, ( --- ) the ideal ASF distribution [104]
Sonal et al.
molar fraction value. The logarithmic form of Eq. (9) is a more generalized form of
the ASF distribution model and as shown below (Eq.10):
log
l og
log
M
n
n = ⋅
+
−
(
)
α
α
α
1
(10)
The value of the chain growth probability factor can also be determined from the
ratio of the molar fraction of the two products with different carbon numbers using
experimental data (Eq. 11):
M
M
n
k
n k
=
−
( )
α
(11)
Figure 8a, b (dotted lines) show the variation of α and M n with carbon number,
respectively, and is compared with the experimental trends (solid line). It also
reveals that, in ASF distribution model, the value of chain growth probability factor
α is independent of carbon number. Despite the fact that the ASF distribution model
was based on a well-explained polymerization theory, deviations from the ASF
model of product distribution are observed by various researchers [80, 105, 106].
The deviations, such as high C 1 yield, low C 2 production and different slopes in the
ASF diagram, i.e., changing chain growth probability with carbon number are evident. Also, a widely observed anomaly is related to higher α-olefin production,
which causes a decreasing trend in olefin to paraffin ratio with carbon number.
Fig. 8 ASF distribution plots. (▬) the deviated ASF distribution, ( --- ) the ideal ASF distribution [104]
Sonal et al.