

446
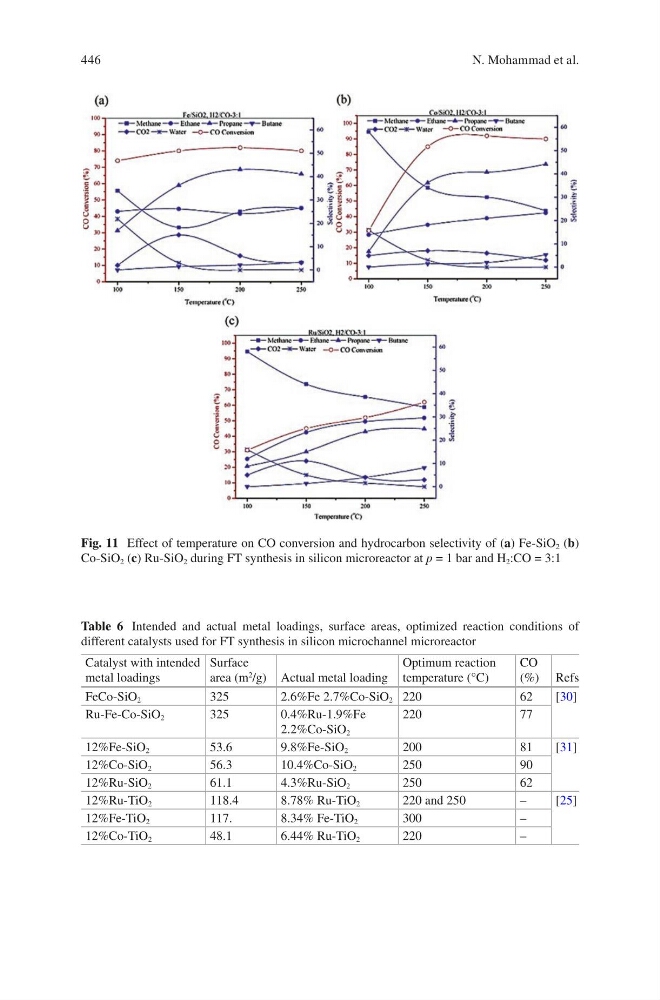
Fig. 11 Effect of temperature on CO conversion and hydrocarbon selectivity of (a) Fe-SiO 2 (b)
Co-SiO 2 (c) Ru-SiO 2 during FT synthesis in silicon microreactor at p = 1 bar and H 2 :CO = 3:1
Table 6 Intended and actual metal loadings, surface areas, optimized reaction conditions of
different catalysts used for FT synthesis in silicon microchannel microreactor
Catalyst with intended
metal loadings
Surface
area (m
2 /g) Actual metal loading
Optimum reaction
temperature (°C)
CO
(%) Refs
FeCo-SiO 2
325
2.6%Fe 2.7%Co-SiO 2 220
62
[30]
Ru-Fe-Co-SiO 2
325
0.4%Ru-1.9%Fe
2.2%Co-SiO 2
220
77
12%Fe-SiO 2
53.6
9.8%Fe-SiO 2
200
81
[31]
12%Co-SiO 2
56.3
10.4%Co-SiO 2
250
90
12%Ru-SiO 2
61.1
4.3%Ru-SiO 2
250
62
12%Ru-TiO 2
118.4
8.78% Ru-TiO 2
220 and 250
–
[25]
12%Fe-TiO 2
117.
8.34% Fe-TiO 2
300
–
12%Co-TiO 2
48.1
6.44% Ru-TiO 2
220
–
N. Mohammad et al.
Fig. 11 Effect of temperature on CO conversion and hydrocarbon selectivity of (a) Fe-SiO 2 (b)
Co-SiO 2 (c) Ru-SiO 2 during FT synthesis in silicon microreactor at p = 1 bar and H 2 :CO = 3:1
Table 6 Intended and actual metal loadings, surface areas, optimized reaction conditions of
different catalysts used for FT synthesis in silicon microchannel microreactor
Catalyst with intended
metal loadings
Surface
area (m
2 /g) Actual metal loading
Optimum reaction
temperature (°C)
CO
(%) Refs
FeCo-SiO 2
325
2.6%Fe 2.7%Co-SiO 2 220
62
[30]
Ru-Fe-Co-SiO 2
325
0.4%Ru-1.9%Fe
2.2%Co-SiO 2
220
77
12%Fe-SiO 2
53.6
9.8%Fe-SiO 2
200
81
[31]
12%Co-SiO 2
56.3
10.4%Co-SiO 2
250
90
12%Ru-SiO 2
61.1
4.3%Ru-SiO 2
250
62
12%Ru-TiO 2
118.4
8.78% Ru-TiO 2
220 and 250
–
[25]
12%Fe-TiO 2
117.
8.34% Fe-TiO 2
300
–
12%Co-TiO 2
48.1
6.44% Ru-TiO 2
220
–
N. Mohammad et al.