

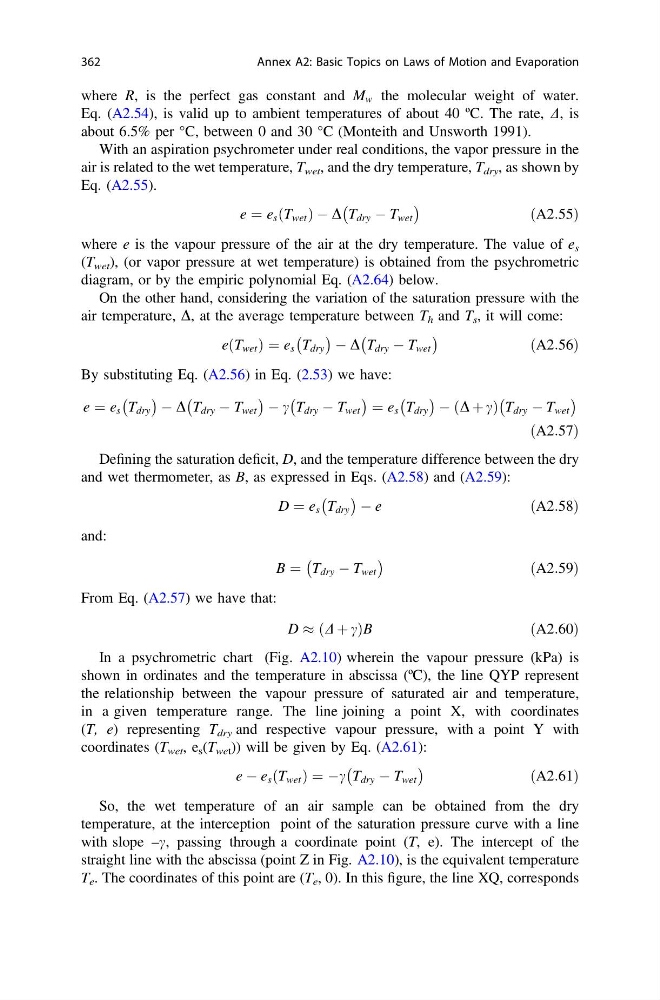
where R, is the perfect gas constant and M w the molecular weight of water.
Eq. (A2.54), is valid up to ambient temperatures of about 40 ºC. The rate, D, is
about 6.5% per °C, between 0 and 30 °C (Monteith and Unsworth 1991).
With an aspiration psychrometer under real conditions, the vapor pressure in the
air is related to the wet temperature, T wet , and the dry temperature, T dry , as shown by
Eq. (A2.55).
e ¼ e s T wet
ð
ÞÀD T dry À T wet
À
Á
ðA2:55Þ
where e is the vapour pressure of the air at the dry temperature. The value of e s
(T wet ), (or vapor pressure at wet temperature) is obtained from the psychrometric
diagram, or by the empiric polynomial Eq. (A2.64) below.
On the other hand, considering the variation of the saturation pressure with the
air temperature, D, at the average temperature between T h and T s , it will come:
e T wet
ð
Þ ¼ e s T dry
À
Á À D T dry À T wet
À
Á
ðA2:56Þ
By substituting Eq. (A2.56) in Eq. (2.53) we have:
e ¼ e s T dry
À
Á À D T dry À T wet
À
Á À c T dry À T wet
À
Á ¼ e s T dry
À
Á À ðD þ cÞ T dry À T wet
À
Á
ðA2:57Þ
Defining the saturation deficit, D, and the temperature difference between the dry
and wet thermometer, as B, as expressed in Eqs. (A2.58) and (A2.59):
D ¼ e s T dry
À
Á À e
ðA2:58Þ
and:
B ¼ T dry À T wet
À
Á
ðA2:59Þ
From Eq. (A2.57) we have that:
D % ðD þ cÞB
ðA2:60Þ
In a psychrometric chart (Fig. A2.10) wherein the vapour pressure (kPa) is
shown in ordinates and the temperature in abscissa (ºC), the line QYP represent
the relationship between the vapour pressure of saturated air and temperature,
in a given temperature range. The line joining a point X, with coordinates
(T, e) representing T dry and respective vapour pressure, with a point Y with
coordinates (T wet , e s (T wet )) will be given by Eq. (A2.61):
e À e s T wet
ð
Þ ¼ Àc T dry À T wet
À
Á
ðA2:61Þ
So, the wet temperature of an air sample can be obtained from the dry
temperature, at the interception point of the saturation pressure curve with a line
with slope –c, passing through a coordinate point (T, e). The intercept of the
straight line with the abscissa (point Z in Fig. A2.10), is the equivalent temperature
T e . The coordinates of this point are (T e , 0). In this figure, the line XQ, corresponds
362
Annex A2: Basic Topics on Laws of Motion and Evaporation
Eq. (A2.54), is valid up to ambient temperatures of about 40 ºC. The rate, D, is
about 6.5% per °C, between 0 and 30 °C (Monteith and Unsworth 1991).
With an aspiration psychrometer under real conditions, the vapor pressure in the
air is related to the wet temperature, T wet , and the dry temperature, T dry , as shown by
Eq. (A2.55).
e ¼ e s T wet
ð
ÞÀD T dry À T wet
À
Á
ðA2:55Þ
where e is the vapour pressure of the air at the dry temperature. The value of e s
(T wet ), (or vapor pressure at wet temperature) is obtained from the psychrometric
diagram, or by the empiric polynomial Eq. (A2.64) below.
On the other hand, considering the variation of the saturation pressure with the
air temperature, D, at the average temperature between T h and T s , it will come:
e T wet
ð
Þ ¼ e s T dry
À
Á À D T dry À T wet
À
Á
ðA2:56Þ
By substituting Eq. (A2.56) in Eq. (2.53) we have:
e ¼ e s T dry
À
Á À D T dry À T wet
À
Á À c T dry À T wet
À
Á ¼ e s T dry
À
Á À ðD þ cÞ T dry À T wet
À
Á
ðA2:57Þ
Defining the saturation deficit, D, and the temperature difference between the dry
and wet thermometer, as B, as expressed in Eqs. (A2.58) and (A2.59):
D ¼ e s T dry
À
Á À e
ðA2:58Þ
and:
B ¼ T dry À T wet
À
Á
ðA2:59Þ
From Eq. (A2.57) we have that:
D % ðD þ cÞB
ðA2:60Þ
In a psychrometric chart (Fig. A2.10) wherein the vapour pressure (kPa) is
shown in ordinates and the temperature in abscissa (ºC), the line QYP represent
the relationship between the vapour pressure of saturated air and temperature,
in a given temperature range. The line joining a point X, with coordinates
(T, e) representing T dry and respective vapour pressure, with a point Y with
coordinates (T wet , e s (T wet )) will be given by Eq. (A2.61):
e À e s T wet
ð
Þ ¼ Àc T dry À T wet
À
Á
ðA2:61Þ
So, the wet temperature of an air sample can be obtained from the dry
temperature, at the interception point of the saturation pressure curve with a line
with slope –c, passing through a coordinate point (T, e). The intercept of the
straight line with the abscissa (point Z in Fig. A2.10), is the equivalent temperature
T e . The coordinates of this point are (T e , 0). In this figure, the line XQ, corresponds
362
Annex A2: Basic Topics on Laws of Motion and Evaporation