

Over the period 1870–2017, estimates of average accumulated EF and ELU
were about 1550 Gt CO 2 and 690 Gt CO 2 , respectively. For this period, the average
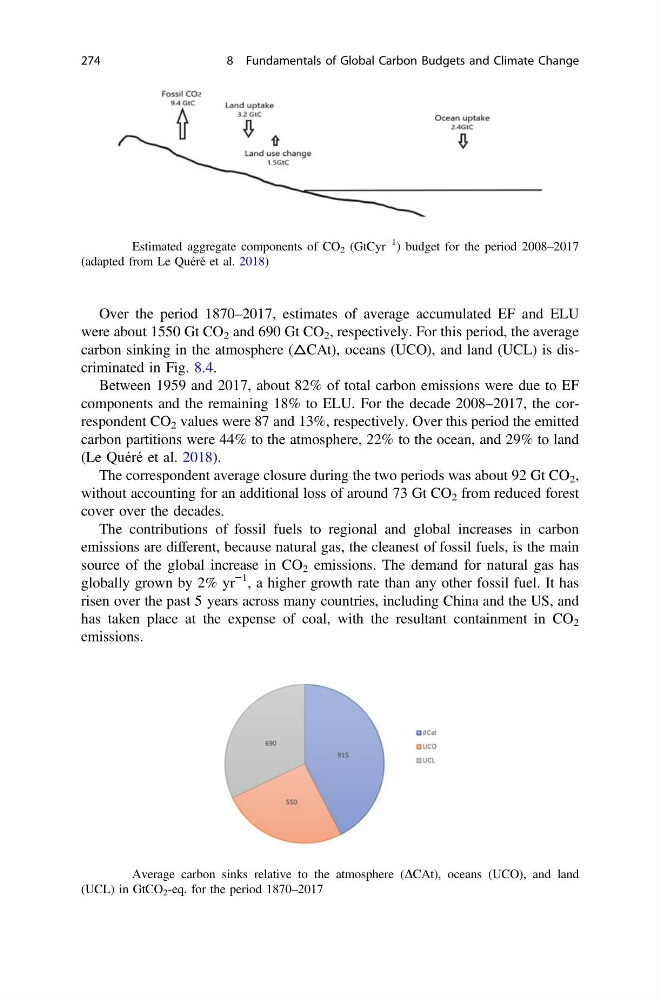
carbon sinking in the atmosphere (△CAt), oceans (UCO), and land (UCL) is discriminated in Fig. 8.4.
Between 1959 and 2017, about 82% of total carbon emissions were due to EF
components and the remaining 18% to ELU. For the decade 2008–2017, the correspondent CO 2 values were 87 and 13%, respectively. Over this period the emitted
carbon partitions were 44% to the atmosphere, 22% to the ocean, and 29% to land
(Le Quéré et al. 2018).
The correspondent average closure during the two periods was about 92 Gt CO 2 ,
without accounting for an additional loss of around 73 Gt CO 2 from reduced forest
cover over the decades.
The contributions of fossil fuels to regional and global increases in carbon
emissions are different, because natural gas, the cleanest of fossil fuels, is the main
source of the global increase in CO 2 emissions. The demand for natural gas has
globally grown by 2% yr
−1 , a higher growth rate than any other fossil fuel. It has
risen over the past 5 years across many countries, including China and the US, and
has taken place at the expense of coal, with the resultant containment in CO 2
emissions.
Fig. 8.3 Estimated aggregate components of CO 2 (GtCyr
−1
) budget for the period 2008–2017
(adapted from Le Quéré et al. 2018)
Fig. 8.4 Average carbon sinks relative to the atmosphere (DCAt), oceans (UCO), and land
(UCL) in GtCO 2 -eq. for the period 1870–2017
274
8 Fundamentals of Global Carbon Budgets and Climate Change
were about 1550 Gt CO 2 and 690 Gt CO 2 , respectively. For this period, the average
carbon sinking in the atmosphere (△CAt), oceans (UCO), and land (UCL) is discriminated in Fig. 8.4.
Between 1959 and 2017, about 82% of total carbon emissions were due to EF
components and the remaining 18% to ELU. For the decade 2008–2017, the correspondent CO 2 values were 87 and 13%, respectively. Over this period the emitted
carbon partitions were 44% to the atmosphere, 22% to the ocean, and 29% to land
(Le Quéré et al. 2018).
The correspondent average closure during the two periods was about 92 Gt CO 2 ,
without accounting for an additional loss of around 73 Gt CO 2 from reduced forest
cover over the decades.
The contributions of fossil fuels to regional and global increases in carbon
emissions are different, because natural gas, the cleanest of fossil fuels, is the main
source of the global increase in CO 2 emissions. The demand for natural gas has
globally grown by 2% yr
−1 , a higher growth rate than any other fossil fuel. It has
risen over the past 5 years across many countries, including China and the US, and
has taken place at the expense of coal, with the resultant containment in CO 2
emissions.
Fig. 8.3 Estimated aggregate components of CO 2 (GtCyr
−1
) budget for the period 2008–2017
(adapted from Le Quéré et al. 2018)
Fig. 8.4 Average carbon sinks relative to the atmosphere (DCAt), oceans (UCO), and land
(UCL) in GtCO 2 -eq. for the period 1870–2017
274
8 Fundamentals of Global Carbon Budgets and Climate Change