

Solution: As the soil surface is at a higher temperature than the atmosphere, there is
heat transfer between the surface of the canopy and the surrounding atmosphere.
The amount of heat exchanged mainly depends on this temperature difference and
the wind speed along the surface.
Firstly data of u (ms
−1 ) and Ln(z) in Table 7.5 are graphed in Fig. 7.7 delivering
a linear equation:
y ¼ 0:69x À 0:85
ð7:12Þ
Assuming that the atmosphere is neutral, the loss of sensible heat from the soil to
the atmosphere can be calculated from the difference between soil and air temperatures by
H ¼
qc p
r aM
T soil À T atm
ð
Þ
ð 7:13Þ
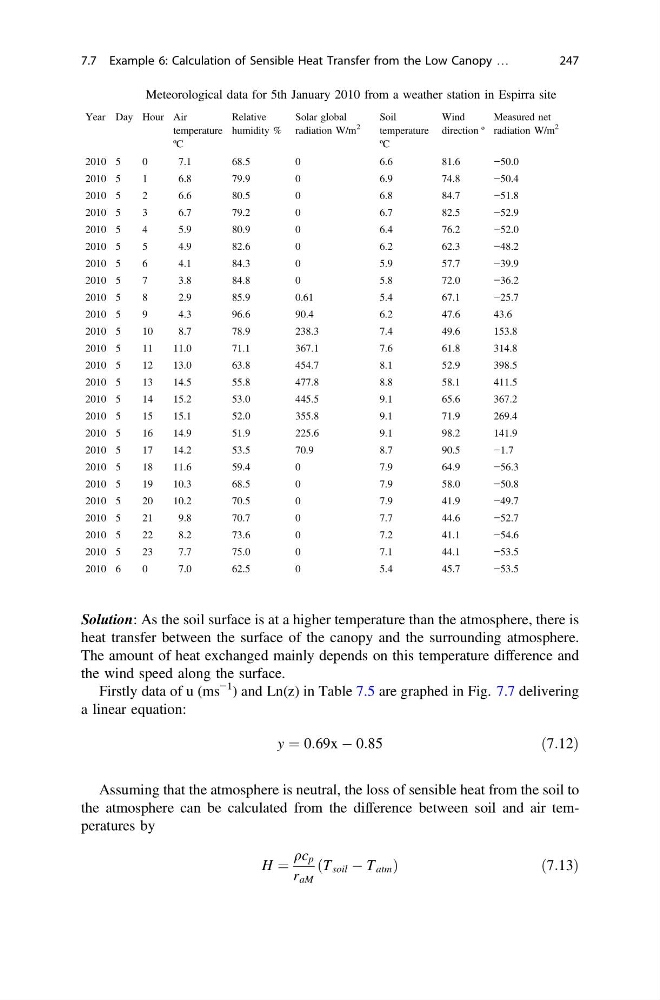
Table. 7.4 Meteorological data for 5th January 2010 from a weather station in Espirra site
Year Day Hour Air
temperature
ºC
Relative
humidity %
Solar global
radiation W/m
2
Soil
temperature
ºC
Wind
direction º
Measured net
radiation W/m
2
2010 5
0
7.1
68.5
0
6.6
81.6
−50.0
2010 5
1
6.8
79.9
0
6.9
74.8
−50.4
2010 5
2
6.6
80.5
0
6.8
84.7
−51.8
2010 5
3
6.7
79.2
0
6.7
82.5
−52.9
2010 5
4
5.9
80.9
0
6.4
76.2
−52.0
2010 5
5
4.9
82.6
0
6.2
62.3
−48.2
2010 5
6
4.1
84.3
0
5.9
57.7
−39.9
2010 5
7
3.8
84.8
0
5.8
72.0
−36.2
2010 5
8
2.9
85.9
0.61
5.4
67.1
−25.7
2010 5
9
4.3
96.6
90.4
6.2
47.6
43.6
2010 5
10
8.7
78.9
238.3
7.4
49.6
153.8
2010 5
11
11.0
71.1
367.1
7.6
61.8
314.8
2010 5
12
13.0
63.8
454.7
8.1
52.9
398.5
2010 5
13
14.5
55.8
477.8
8.8
58.1
411.5
2010 5
14
15.2
53.0
445.5
9.1
65.6
367.2
2010 5
15
15.1
52.0
355.8
9.1
71.9
269.4
2010 5
16
14.9
51.9
225.6
9.1
98.2
141.9
2010 5
17
14.2
53.5
70.9
8.7
90.5
−1.7
2010 5
18
11.6
59.4
0
7.9
64.9
−56.3
2010 5
19
10.3
68.5
0
7.9
58.0
−50.8
2010 5
20
10.2
70.5
0
7.9
41.9
−49.7
2010 5
21
9.8
70.7
0
7.7
44.6
−52.7
2010 5
22
8.2
73.6
0
7.2
41.1
−54.6
2010 5
23
7.7
75.0
0
7.1
44.1
−53.5
2010 6
0
7.0
62.5
0
5.4
45.7
−53.5
7.7 Example 6: Calculation of Sensible Heat Transfer from the Low Canopy …
247
heat transfer between the surface of the canopy and the surrounding atmosphere.
The amount of heat exchanged mainly depends on this temperature difference and
the wind speed along the surface.
Firstly data of u (ms
−1 ) and Ln(z) in Table 7.5 are graphed in Fig. 7.7 delivering
a linear equation:
y ¼ 0:69x À 0:85
ð7:12Þ
Assuming that the atmosphere is neutral, the loss of sensible heat from the soil to
the atmosphere can be calculated from the difference between soil and air temperatures by
H ¼
qc p
r aM
T soil À T atm
ð
Þ
ð 7:13Þ
Table. 7.4 Meteorological data for 5th January 2010 from a weather station in Espirra site
Year Day Hour Air
temperature
ºC
Relative
humidity %
Solar global
radiation W/m
2
Soil
temperature
ºC
Wind
direction º
Measured net
radiation W/m
2
2010 5
0
7.1
68.5
0
6.6
81.6
−50.0
2010 5
1
6.8
79.9
0
6.9
74.8
−50.4
2010 5
2
6.6
80.5
0
6.8
84.7
−51.8
2010 5
3
6.7
79.2
0
6.7
82.5
−52.9
2010 5
4
5.9
80.9
0
6.4
76.2
−52.0
2010 5
5
4.9
82.6
0
6.2
62.3
−48.2
2010 5
6
4.1
84.3
0
5.9
57.7
−39.9
2010 5
7
3.8
84.8
0
5.8
72.0
−36.2
2010 5
8
2.9
85.9
0.61
5.4
67.1
−25.7
2010 5
9
4.3
96.6
90.4
6.2
47.6
43.6
2010 5
10
8.7
78.9
238.3
7.4
49.6
153.8
2010 5
11
11.0
71.1
367.1
7.6
61.8
314.8
2010 5
12
13.0
63.8
454.7
8.1
52.9
398.5
2010 5
13
14.5
55.8
477.8
8.8
58.1
411.5
2010 5
14
15.2
53.0
445.5
9.1
65.6
367.2
2010 5
15
15.1
52.0
355.8
9.1
71.9
269.4
2010 5
16
14.9
51.9
225.6
9.1
98.2
141.9
2010 5
17
14.2
53.5
70.9
8.7
90.5
−1.7
2010 5
18
11.6
59.4
0
7.9
64.9
−56.3
2010 5
19
10.3
68.5
0
7.9
58.0
−50.8
2010 5
20
10.2
70.5
0
7.9
41.9
−49.7
2010 5
21
9.8
70.7
0
7.7
44.6
−52.7
2010 5
22
8.2
73.6
0
7.2
41.1
−54.6
2010 5
23
7.7
75.0
0
7.1
44.1
−53.5
2010 6
0
7.0
62.5
0
5.4
45.7
−53.5
7.7 Example 6: Calculation of Sensible Heat Transfer from the Low Canopy …
247