

flow in the cavity area. This recirculation of air along the building walls causes a
circulation pattern in the horizontal plane of the cavity zone, in which, the
streamlines form a horseshoe pattern running in opposite directions.
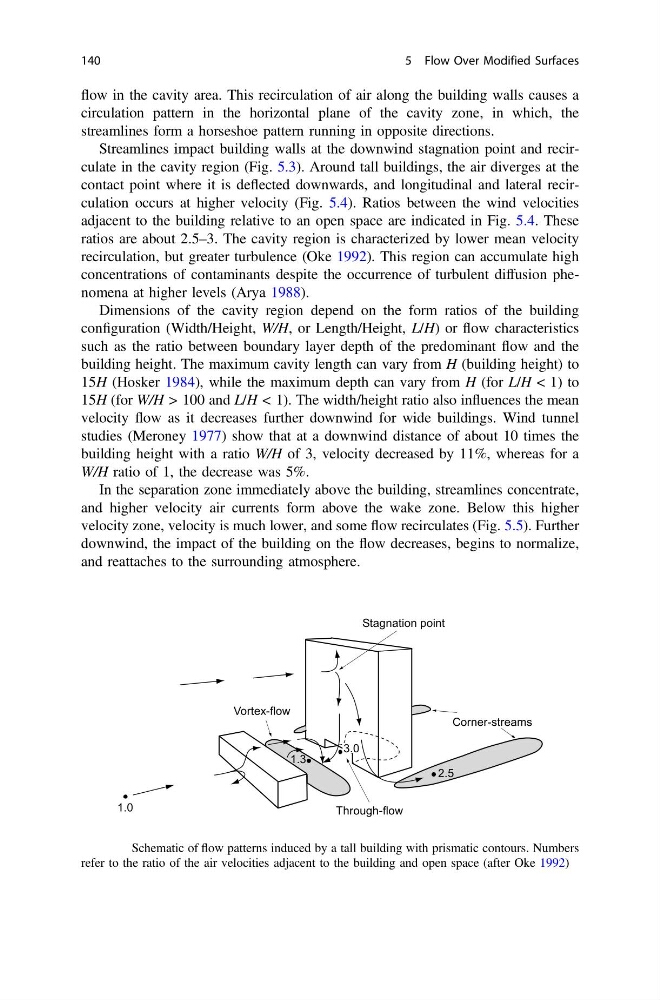
Streamlines impact building walls at the downwind stagnation point and recirculate in the cavity region (Fig. 5.3). Around tall buildings, the air diverges at the
contact point where it is deflected downwards, and longitudinal and lateral recirculation occurs at higher velocity (Fig. 5.4). Ratios between the wind velocities
adjacent to the building relative to an open space are indicated in Fig. 5.4. These
ratios are about 2.5–3. The cavity region is characterized by lower mean velocity
recirculation, but greater turbulence (Oke 1992). This region can accumulate high
concentrations of contaminants despite the occurrence of turbulent diffusion phenomena at higher levels (Arya 1988).
Dimensions of the cavity region depend on the form ratios of the building
configuration (Width/Height, W/H, or Length/Height, L/H) or flow characteristics
such as the ratio between boundary layer depth of the predominant flow and the
building height. The maximum cavity length can vary from H (building height) to
15H (Hosker 1984), while the maximum depth can vary from H (for L/H < 1) to
15H (for W/H > 100 and L/H < 1). The width/height ratio also influences the mean
velocity flow as it decreases further downwind for wide buildings. Wind tunnel
studies (Meroney 1977) show that at a downwind distance of about 10 times the
building height with a ratio W/H of 3, velocity decreased by 11%, whereas for a
W/H ratio of 1, the decrease was 5%.
In the separation zone immediately above the building, streamlines concentrate,
and higher velocity air currents form above the wake zone. Below this higher
velocity zone, velocity is much lower, and some flow recirculates (Fig. 5.5). Further
downwind, the impact of the building on the flow decreases, begins to normalize,
and reattaches to the surrounding atmosphere.
Corner-streams
Vortex-flow
Through-flow
Stagnation point
3.0
2.5
1.3
1.0
Fig. 5.4 Schematic of flow patterns induced by a tall building with prismatic contours. Numbers
refer to the ratio of the air velocities adjacent to the building and open space (after Oke 1992)
140
5 Flow Over Modified Surfaces
circulation pattern in the horizontal plane of the cavity zone, in which, the
streamlines form a horseshoe pattern running in opposite directions.
Streamlines impact building walls at the downwind stagnation point and recirculate in the cavity region (Fig. 5.3). Around tall buildings, the air diverges at the
contact point where it is deflected downwards, and longitudinal and lateral recirculation occurs at higher velocity (Fig. 5.4). Ratios between the wind velocities
adjacent to the building relative to an open space are indicated in Fig. 5.4. These
ratios are about 2.5–3. The cavity region is characterized by lower mean velocity
recirculation, but greater turbulence (Oke 1992). This region can accumulate high
concentrations of contaminants despite the occurrence of turbulent diffusion phenomena at higher levels (Arya 1988).
Dimensions of the cavity region depend on the form ratios of the building
configuration (Width/Height, W/H, or Length/Height, L/H) or flow characteristics
such as the ratio between boundary layer depth of the predominant flow and the
building height. The maximum cavity length can vary from H (building height) to
15H (Hosker 1984), while the maximum depth can vary from H (for L/H < 1) to
15H (for W/H > 100 and L/H < 1). The width/height ratio also influences the mean
velocity flow as it decreases further downwind for wide buildings. Wind tunnel
studies (Meroney 1977) show that at a downwind distance of about 10 times the
building height with a ratio W/H of 3, velocity decreased by 11%, whereas for a
W/H ratio of 1, the decrease was 5%.
In the separation zone immediately above the building, streamlines concentrate,
and higher velocity air currents form above the wake zone. Below this higher
velocity zone, velocity is much lower, and some flow recirculates (Fig. 5.5). Further
downwind, the impact of the building on the flow decreases, begins to normalize,
and reattaches to the surrounding atmosphere.
Corner-streams
Vortex-flow
Through-flow
Stagnation point
3.0
2.5
1.3
1.0
Fig. 5.4 Schematic of flow patterns induced by a tall building with prismatic contours. Numbers
refer to the ratio of the air velocities adjacent to the building and open space (after Oke 1992)
140
5 Flow Over Modified Surfaces