

depends on canopy temperature which is a function of the absorbed solar radiation.
Equation (4.29) couples the evaporative potential of forest canopies to the air
temperature and atmospheric vapor pressure deficit. Higher roughness of forest
canopies implies that the direct flux of latent heat is controlled primarily by
physiological factors and air humidity.
The equilibrium evapotranspiration rates also depend on flow intensity in the
boundary layer adjacent to the forest canopy. The soil–plant–atmosphere dynamics
over canopies are disturbed by intermittent turbulent phenomena, but the intervals
between these phenomena are not long enough to affect equilibrium evapotranspiration rates (Kelliher et al. 1990).
The stomatal resistance increases and according to Eq. (4.27), X decreases
because of water deficiency in soil (Monteith and Unsworth 2013; Balddochi et al.
1997). Water equilibrium is regulated by stomatal activity, through mechanisms
such as the release of abscisic acid from roots, which promote stomata closure
(Balddochi et al. 1997). The soil water content will depend on soil texture and
capacity to retain or release water, and the possibilities for roots to tap deep into the
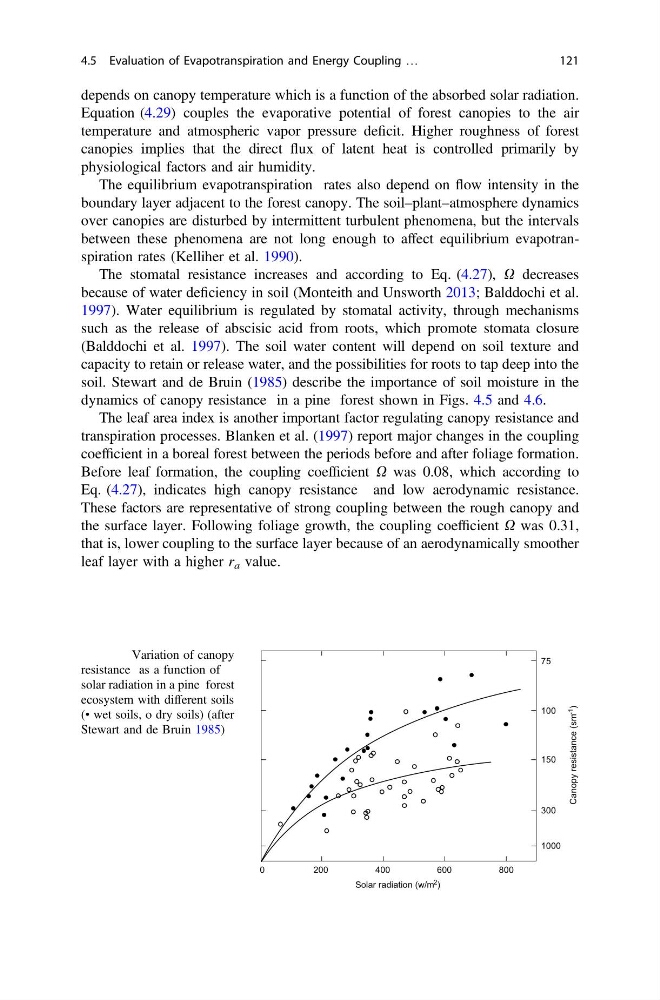
soil. Stewart and de Bruin (1985) describe the importance of soil moisture in the
dynamics of canopy resistance in a pine forest shown in Figs. 4.5 and 4.6.
The leaf area index is another important factor regulating canopy resistance and
transpiration processes. Blanken et al. (1997) report major changes in the coupling
coefficient in a boreal forest between the periods before and after foliage formation.
Before leaf formation, the coupling coefficient X was 0.08, which according to
Eq. (4.27), indicates high canopy resistance and low aerodynamic resistance.
These factors are representative of strong coupling between the rough canopy and
the surface layer. Following foliage growth, the coupling coefficient X was 0.31,
that is, lower coupling to the surface layer because of an aerodynamically smoother
leaf layer with a higher r a value.
0
200
400
600
800
Solar radiation (w/m 2 )
Canopy resistance (sm -1
)
75
100
1000
300
150
Fig. 4.5 Variation of canopy
resistance as a function of
solar radiation in a pine forest
ecosystem with different soils
(• wet soils, o dry soils) (after
Stewart and de Bruin 1985)
4.5 Evaluation of Evapotranspiration and Energy Coupling …
121
Equation (4.29) couples the evaporative potential of forest canopies to the air
temperature and atmospheric vapor pressure deficit. Higher roughness of forest
canopies implies that the direct flux of latent heat is controlled primarily by
physiological factors and air humidity.
The equilibrium evapotranspiration rates also depend on flow intensity in the
boundary layer adjacent to the forest canopy. The soil–plant–atmosphere dynamics
over canopies are disturbed by intermittent turbulent phenomena, but the intervals
between these phenomena are not long enough to affect equilibrium evapotranspiration rates (Kelliher et al. 1990).
The stomatal resistance increases and according to Eq. (4.27), X decreases
because of water deficiency in soil (Monteith and Unsworth 2013; Balddochi et al.
1997). Water equilibrium is regulated by stomatal activity, through mechanisms
such as the release of abscisic acid from roots, which promote stomata closure
(Balddochi et al. 1997). The soil water content will depend on soil texture and
capacity to retain or release water, and the possibilities for roots to tap deep into the
soil. Stewart and de Bruin (1985) describe the importance of soil moisture in the
dynamics of canopy resistance in a pine forest shown in Figs. 4.5 and 4.6.
The leaf area index is another important factor regulating canopy resistance and
transpiration processes. Blanken et al. (1997) report major changes in the coupling
coefficient in a boreal forest between the periods before and after foliage formation.
Before leaf formation, the coupling coefficient X was 0.08, which according to
Eq. (4.27), indicates high canopy resistance and low aerodynamic resistance.
These factors are representative of strong coupling between the rough canopy and
the surface layer. Following foliage growth, the coupling coefficient X was 0.31,
that is, lower coupling to the surface layer because of an aerodynamically smoother
leaf layer with a higher r a value.
0
200
400
600
800
Solar radiation (w/m 2 )
Canopy resistance (sm -1
)
75
100
1000
300
150
Fig. 4.5 Variation of canopy
resistance as a function of
solar radiation in a pine forest
ecosystem with different soils
(• wet soils, o dry soils) (after
Stewart and de Bruin 1985)
4.5 Evaluation of Evapotranspiration and Energy Coupling …
121