

intervals. Another indicator of the high regularity of intermittent phenomena over
canopies is the correlation between the vertical and horizontal velocities:
R uw ¼ u 0 w 0 =r u r w
ð4:8Þ
so that at the interface between the canopy and the adjacent atmosphere is of the
order of −0.5, significantly greater than the typical value for a flat surface, −0.3, or
at a point located well above the interface (Shaw 1995).
Rapid turbulent phenomena will promote air exchange at different temperatures,
regulating the energy exchanges within the canopy. The retardatory effect of the
airflow is more intense in zones with higher canopy biomass, whereas areas with
lower biomass density will have a secondary wind speed maximum (Fig. 4.2). This
velocity profile will affect vertical exchanges within the canopy.
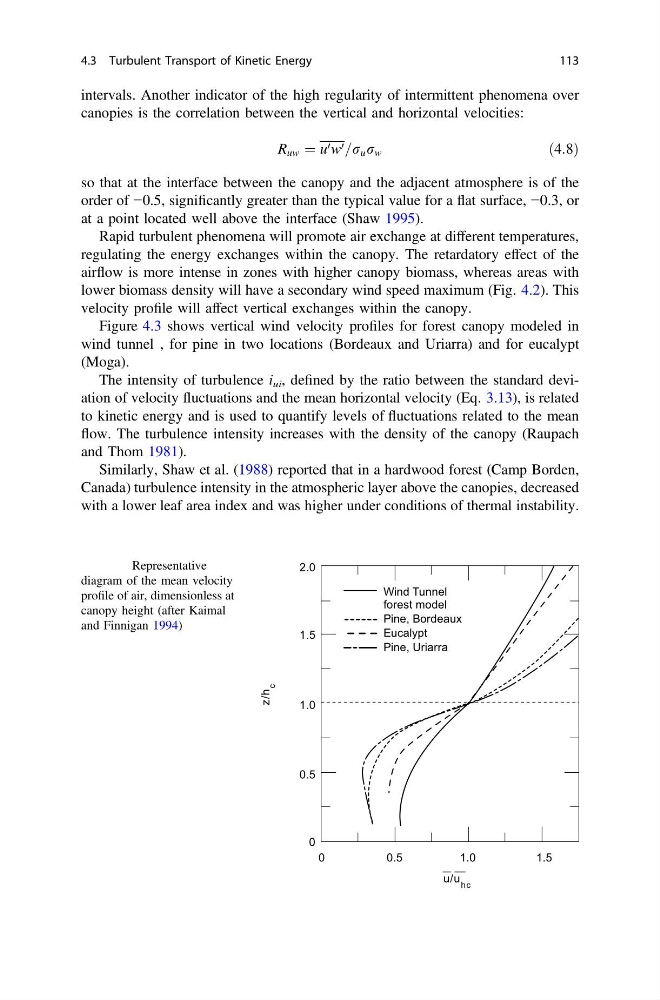
Figure 4.3 shows vertical wind velocity profiles for forest canopy modeled in
wind tunnel , for pine in two locations (Bordeaux and Uriarra) and for eucalypt
(Moga).
The intensity of turbulence i ui , defined by the ratio between the standard deviation of velocity fluctuations and the mean horizontal velocity (Eq. 3.13), is related
to kinetic energy and is used to quantify levels of fluctuations related to the mean
flow. The turbulence intensity increases with the density of the canopy (Raupach
and Thom 1981).
Similarly, Shaw et al. (1988) reported that in a hardwood forest (Camp Borden,
Canada) turbulence intensity in the atmospheric layer above the canopies, decreased
with a lower leaf area index and was higher under conditions of thermal instability.
0.5
0.5
1.0
1.0
z/h
c
u/u hc
2.0
1.5
1.5
0
0
Wind Tunnel
forest model
Pine, Bordeaux
Eucalypt
Pine, Uriarra
Fig. 4.3 Representative
diagram of the mean velocity
profile of air, dimensionless at
canopy height (after Kaimal
and Finnigan 1994)
4.3 Turbulent Transport of Kinetic Energy
113
canopies is the correlation between the vertical and horizontal velocities:
R uw ¼ u 0 w 0 =r u r w
ð4:8Þ
so that at the interface between the canopy and the adjacent atmosphere is of the
order of −0.5, significantly greater than the typical value for a flat surface, −0.3, or
at a point located well above the interface (Shaw 1995).
Rapid turbulent phenomena will promote air exchange at different temperatures,
regulating the energy exchanges within the canopy. The retardatory effect of the
airflow is more intense in zones with higher canopy biomass, whereas areas with
lower biomass density will have a secondary wind speed maximum (Fig. 4.2). This
velocity profile will affect vertical exchanges within the canopy.
Figure 4.3 shows vertical wind velocity profiles for forest canopy modeled in
wind tunnel , for pine in two locations (Bordeaux and Uriarra) and for eucalypt
(Moga).
The intensity of turbulence i ui , defined by the ratio between the standard deviation of velocity fluctuations and the mean horizontal velocity (Eq. 3.13), is related
to kinetic energy and is used to quantify levels of fluctuations related to the mean
flow. The turbulence intensity increases with the density of the canopy (Raupach
and Thom 1981).
Similarly, Shaw et al. (1988) reported that in a hardwood forest (Camp Borden,
Canada) turbulence intensity in the atmospheric layer above the canopies, decreased
with a lower leaf area index and was higher under conditions of thermal instability.
0.5
0.5
1.0
1.0
z/h
c
u/u hc
2.0
1.5
1.5
0
0
Wind Tunnel
forest model
Pine, Bordeaux
Eucalypt
Pine, Uriarra
Fig. 4.3 Representative
diagram of the mean velocity
profile of air, dimensionless at
canopy height (after Kaimal
and Finnigan 1994)
4.3 Turbulent Transport of Kinetic Energy
113